Gold is on a hot streak lately as Wall Street continues to hammer on the dollar.
And combined with fears from COVID, it pushed gold to record highs reached a decade ago.
Now you have fund managers and bankers all saying that gold is a buy for the near term.
There are even rumors of gold being more valuable than the SP500.
But before all of the move even began, I noticed a sign in the Fractal Energy Indicator that gave away the move.
Let me explain…
The Future Of Gold
Due to the recent Covid pandemic, gold prices have been pushed to their highest levels in a decade.
Investors have been telling clients that they should expect the rally to continue beyond this level… at least for the near term.
As many firms are bullish on gold, they are saying it will make all time highs in terms of US Dollars and all other currencies.
Recently the price of gold has traded to a high of $1982.80… putting it in record high territory, higher than the financial collapse levels.
All before another round of stimulus checks from the government.
But all of this comes at a cost… the government can only do one or two things… raise taxes in the future or print more money, both of which raise inflation.
What does this mean?
Well, it means any dollar-backed assets are far less attractive than real assets such as gold and silver.
Why did this happen?
It stems from the cause of inflation worry growing with investors from a decreasing U.S. dollar.
This came from the U.S. government borrowing huge sums of money in order to stabilize and prop up the economy, forcing businesses to close, and causing some of the highest levels of unemployment seen since the great depression.
Now… let’s talk about the technical pattern that signals the Gold markets were going to soar.
Gold And Fractal Energy
As a trader, spending hours going through stock charts and looking for patterns is just part of the day in the life of a professional trader.
To cut down the work that I have to do every day, I focus on stocks that meet qualifications set by the Fractal Energy Indicator.
When looking to understand what price action is doing you need to reference information other than a basic stock chart to get a true edge in the markets.
And by having an indicator such as the Fractal Energy indicator you can determine stocks that are charged to run or exhausted and ready to stall out.
But first – What are fractals?
The power of fractals allows me to determine the strength of trends and how much “life” is remaining in a stock’s movement.
There are 2 main components of Fractal Energy:
- Markets Fractal Pattern
- The Internal Energy
By combining those two different components you create a single indicator that is able to successfully determine the strength or weakness of a trend on any stock.
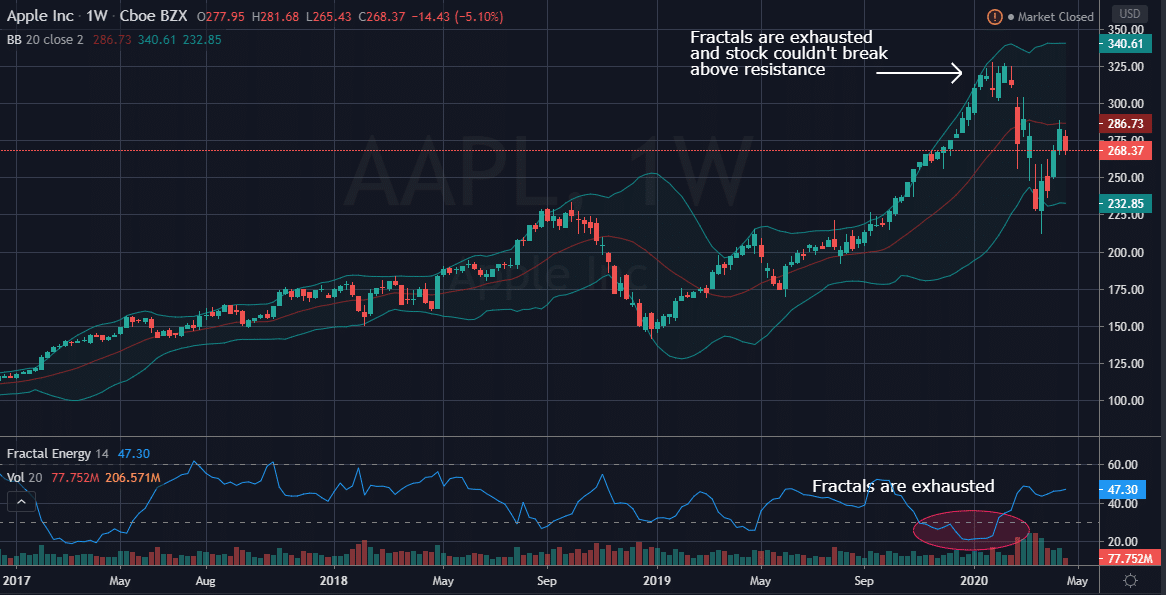
Let’s see what I mean by looking at the chart of AAPL and how it picked the top of the market.
Source: Tradingview
In Apple AAPL you can see that the Fractal Energy Indicator was signaling exhausted energy to AAPL forming at the beginning of 2020. And then shortly afterwards, the stock plunged lower towards the lower Bollinger Bands.
In this chart you can see two key factors as how the trade unfolded:
- Price couldn’t break above the resistance level at $325
- The Fractal Energy Indicator was severely exhausted
From the technical analysis viewpoint, the failed breakout was a large bearish signal for AAPL. Then combined with the internal energy, or Fractal Energy showing that it was weak, it was the perfect setup for AAPL to sell off.
And that’s exactly what happened.
Next… let’s take a look at how this indicator showed a buy signal in gold futures
The Setup
The fractal energy is just an indicator of being charged or exhausted, and it’s important to remember that it does not necessarily pick the direction of the trade.
But that’s where Bollinger Bands come into play.
Since the stock was trading off its lower Bollinger Band, it signals that there was support found at those levels.
And when you combine that with Fractal Energy, you’d now got your direction and your timing aligned.
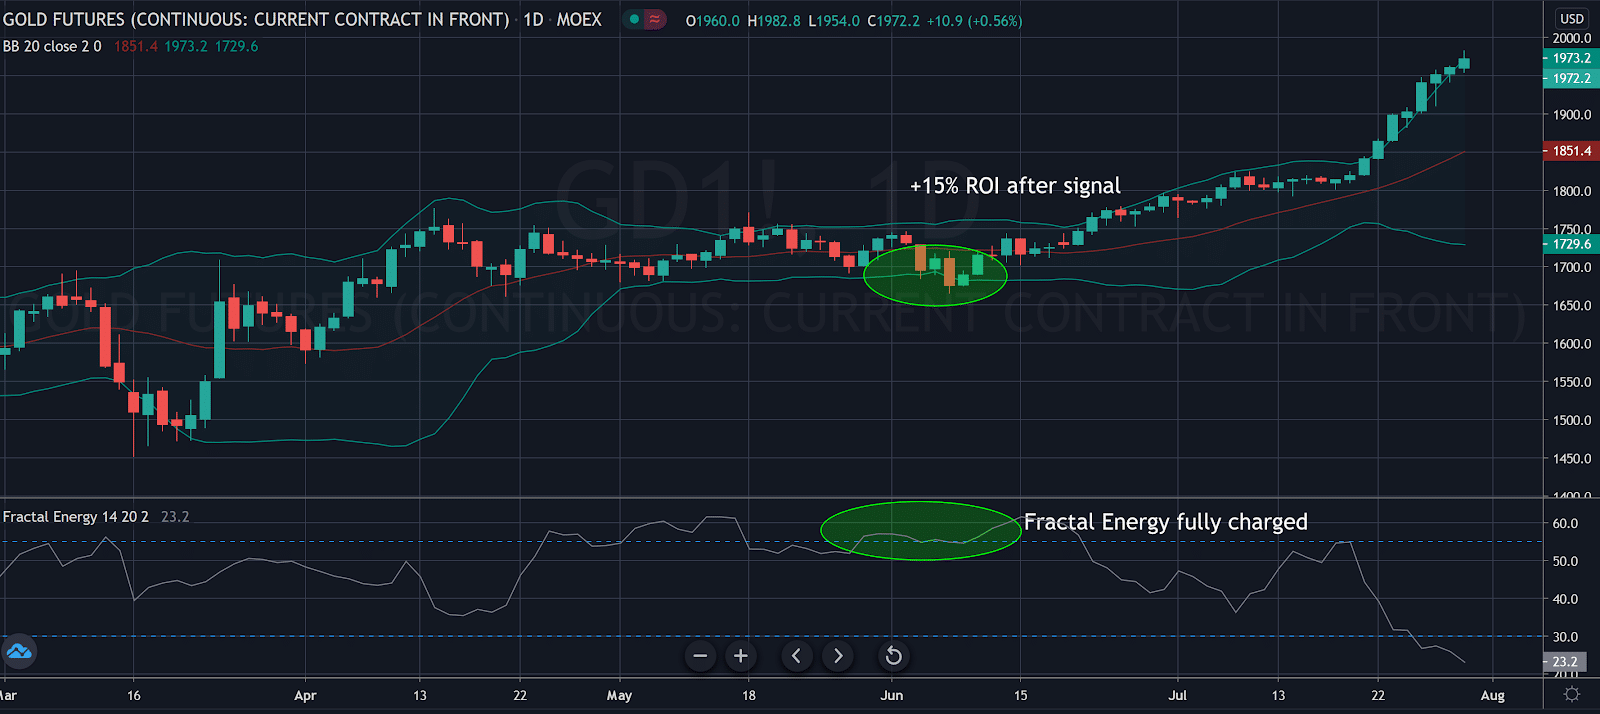
Let’s take a look at Gold Futures now…
Source: Tradingview
The breakdown:
- Gold found support at the lower Bollinger Band
- The overall trend is slightly positive
- Fractals are fully charged
This created nearly the trifecta for the Fractal Energy and is a nearly perfect setup.
Now… let’s take a look at a way you could trade this position, if you used the Gold ETF instead of futures.
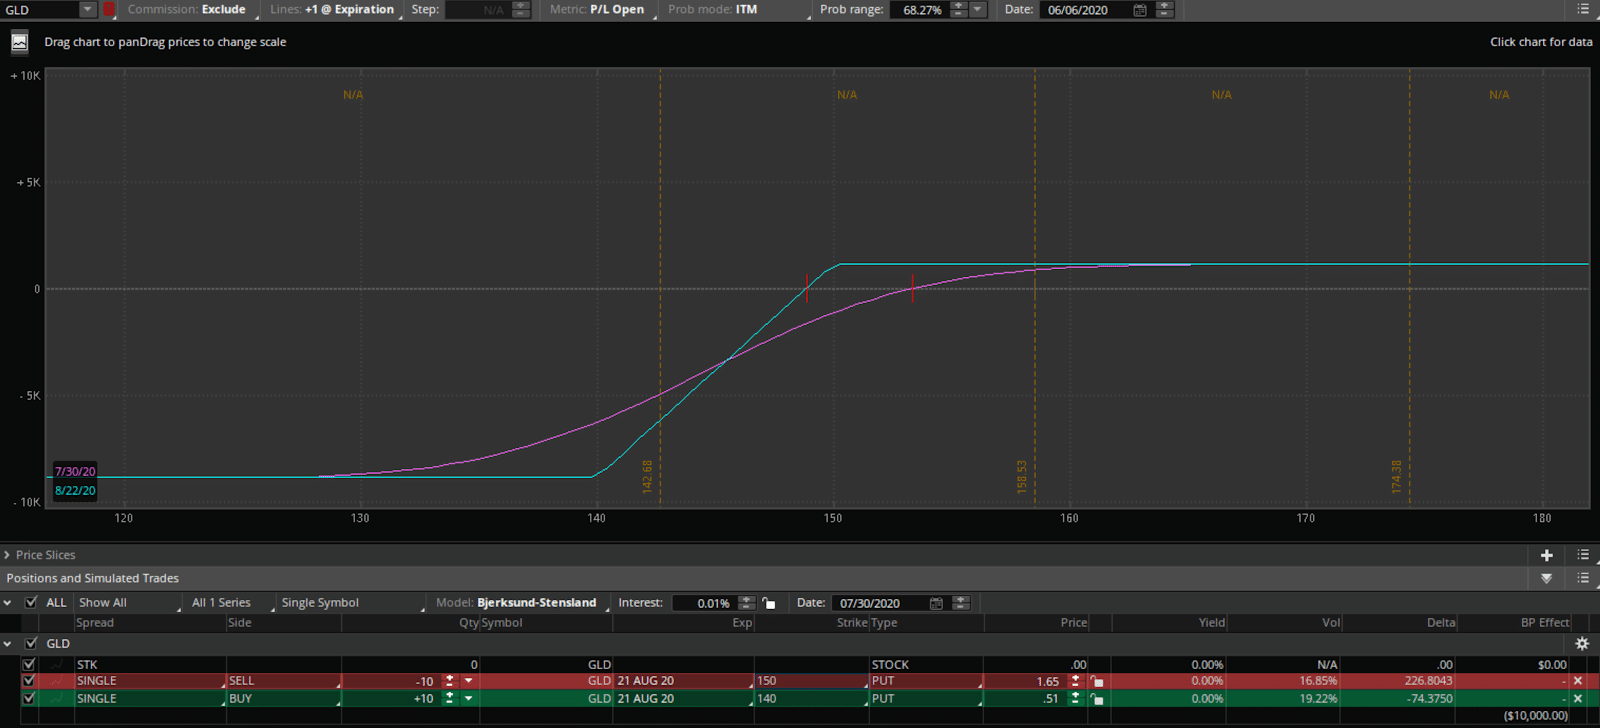
Source: Thinkorswim
As you can tell by watching the GLD run higher, a stock owner would have collected nearly 16%, selling a Credit Put Spread could have generated you nearly 100%.
Now.. what if you wanted to actually go short GLD at these extended levels?
You don’t want to take on unlimited risk by selling naked Calls, but instead you want to leverage a strategy called a Credit Call Spread.
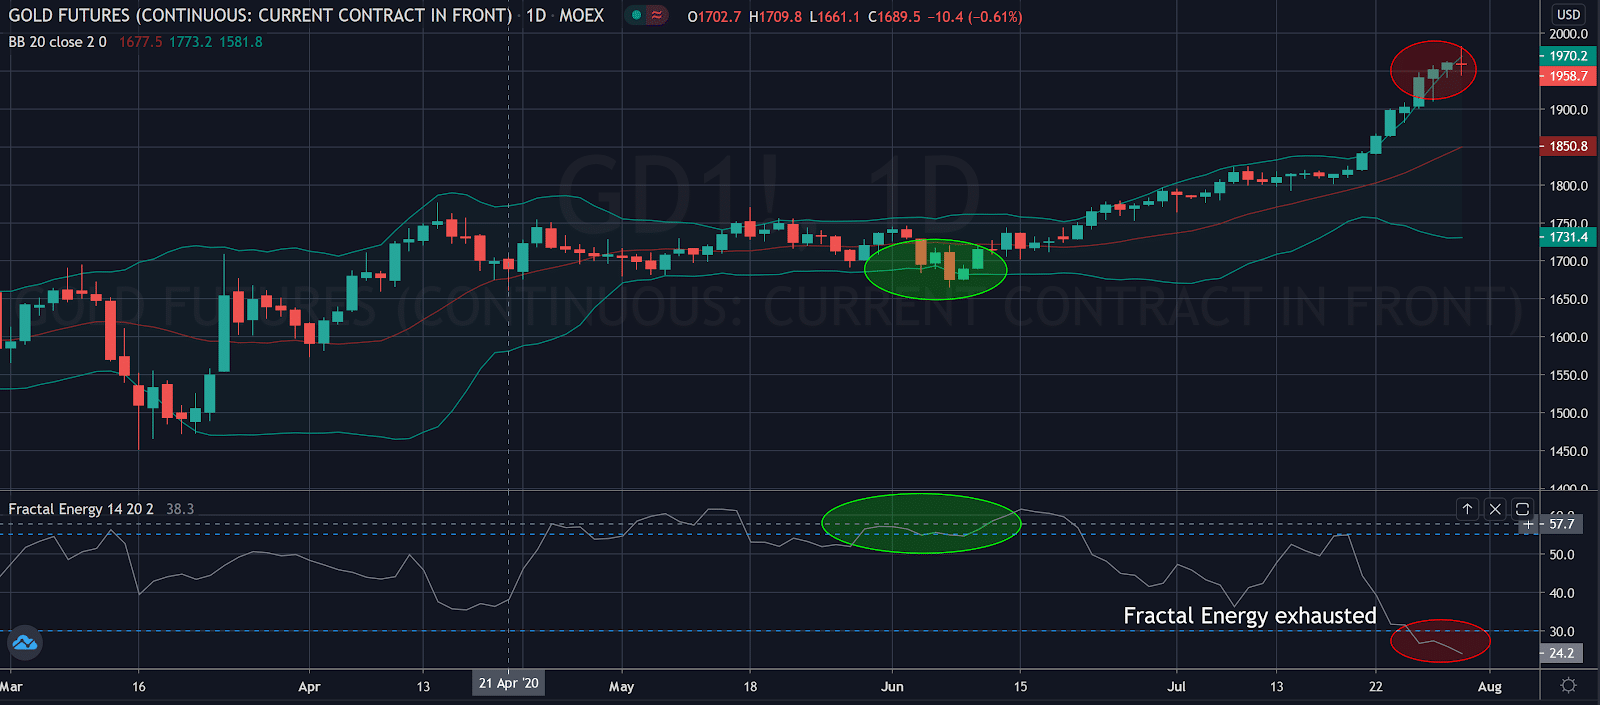
Source: Tradingview
Now you see the Fractal Energy is exhausted and read to signal a top in GLD. How can you trade it?
Well you can use either a Short Call or a Short Call Spread to take this trade.
The risk profile of a short call shows a lot of risk I am not comfortable with taking.
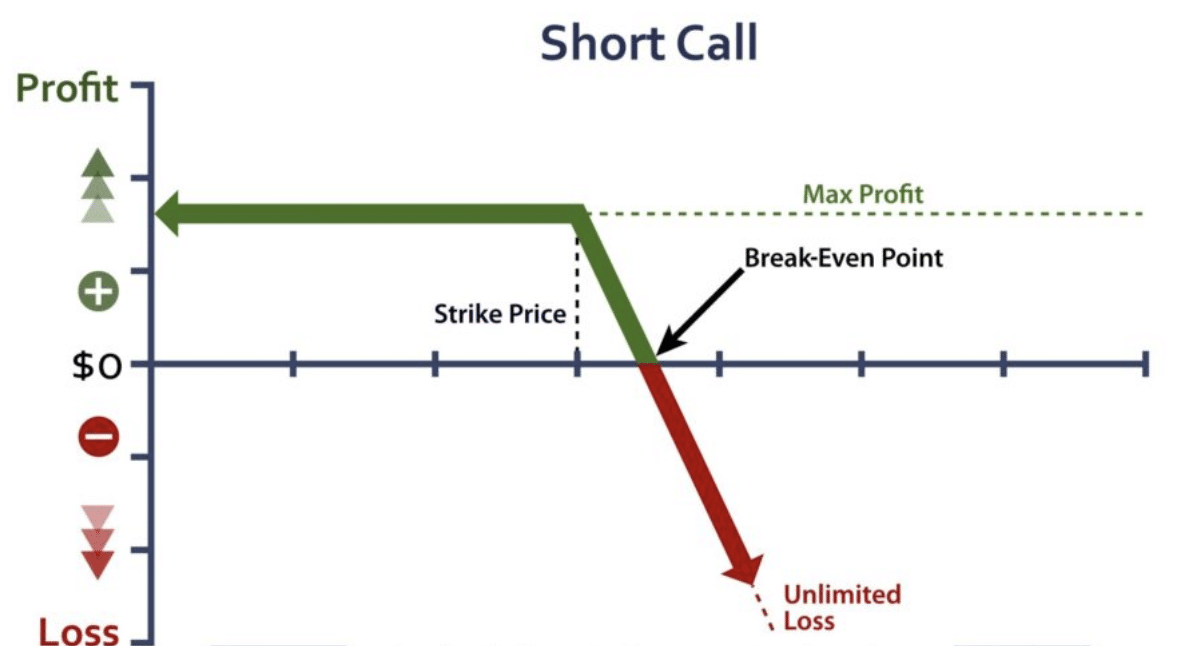
As you can see there is unlimited loss to the upside if GLD decides to never stop running higher.
And that’s not something I want to put my account at risk for. So that’s why I turn to a Credit Call Spread instead.
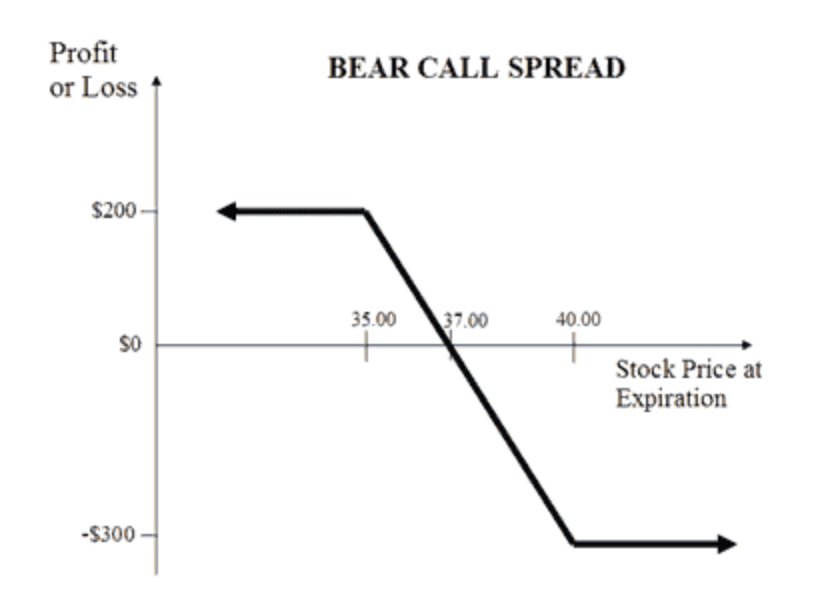
The Credit Call Spread
The Credit Call Spread (or Bear Call Spread) is a bearish to neutral options trading strategy.
It aims to capitalize on both downward price movement of the asset and theta decay.
Credit call spreads work extremely well in both directional and sideways markets as the options will expire worthless at the end of the trade, leaving the premium for the trader to collect on.
What does that mean exactly?
It means that you receive the cash upfront …
That’s right, you get paid to take that trade!
Another huge benefit of this trade is that it has a lower max loss compared to selling calls and even purchasing put options.
As a seller of options, we can still make money even in a sideways market!
This is such a great strategy since it allows me to trade a short call and have a max loss on the trade. This is a must to capitalize on premium decay and also market direction on the trade.
The Odds Are Stacked In Our Favor
Option sellers take maximum advantage of the option time decay theory, commonly known as Theta Decay.
OTM options lose value quickly and become worthless at expiration. This allows traders to not have to worry about correctly predicting the market direction or timing the market perfectly to generate income.
We can take advantage and be the house with odds in our favor on every trade
Don’t forget that an option buyer needs to be right about direction and time!
Remember traders, there are many ways to make money in this market and selling options is one of my absolute favorite go-to strategies.
Key Points:
- Credit Call Spreads profit if the stock goes down, stays the same, or goes up
- Limited risk vs naked calls
- Puts the house odds in your favor
- Allows you to get paid to take risk
Wrapping up
Fractals are the cornerstone of Options Profit Planner and when it comes to placing a trade I always make sure there’s an edge by leveraging the power of the internal energy of a stock and pattern.
And I always make sure that I utilize a strategy of selling options or spreads to focus on generating a steady flow of income for my trading business.
But what’s extremely important to remember is that there is a strategy for both going long and short stocks that are available to you.
Plus Credit Spreads give unique advantages to traders over debit spreads, with the most important being that you are paid upfront to place a trade!
To learn more about options and leveraging the power of Fractal Energy:
0 Comments