Each trading day I focus on combining Fractal Energy with my favorite options strategy.
You see, in order to consistently make money in the markets, I have learned how to identify a stocks underlying trend and then trade around it using technical analysis techniques.
Now, you may have heard some common sayings among traders that hint at this. Some sayings are “Trade with the trend”, “Don’t fight the tape”, or “The trend is your friend”.
But there are a lot of questions that still are unanswered:
- How long does a trend last?
- When should you get in or out of a trade?
- What exactly does it mean to be a short-term trader?
To answer these questions, I am going to dig deeper into trading time frames and how to combine this simple concept with Fractal Energy.
Options Profit Planner
Every day I focused on combining Fractal Energy with Credit Spreads in order to gain an edge in the markets.
I know that not every edge I gain will translate into an edge you can trade right away, but with practice and learning the techniques I use, you can begin your transformation into a more knowledgeable trader.
But first, exactly what is Fractal Energy?
Fractal Energy Indicator
There are 2 main components of Fractal Energy:
- Markets Fractal Pattern
- Stock Internal Energy
Markets Fractal Pattern
In short, fractals are the mathematical model that explains almost everything found throughout nature.
Fractals form complex and visually appealing patterns and are used by companies to aid in their design of logos and symbols used for their company.
I bet you would have no issue identifying FORD is not a fractal pattern… but did you know that Toyota’s famous inter-clocking circle logo is actually based on fractal patterns?
Stock Internal Energy
Energy is the term used to describe the stored or potential energy a stock has built up.
Like a spring that is compressed, it stores potential energy and erupts when you release the force that is keeping it held together.
The power of fractals allows me to determine the strength of trends and how much “life” is remaining in a stock’s movement.
Here’s the power of Fractals:
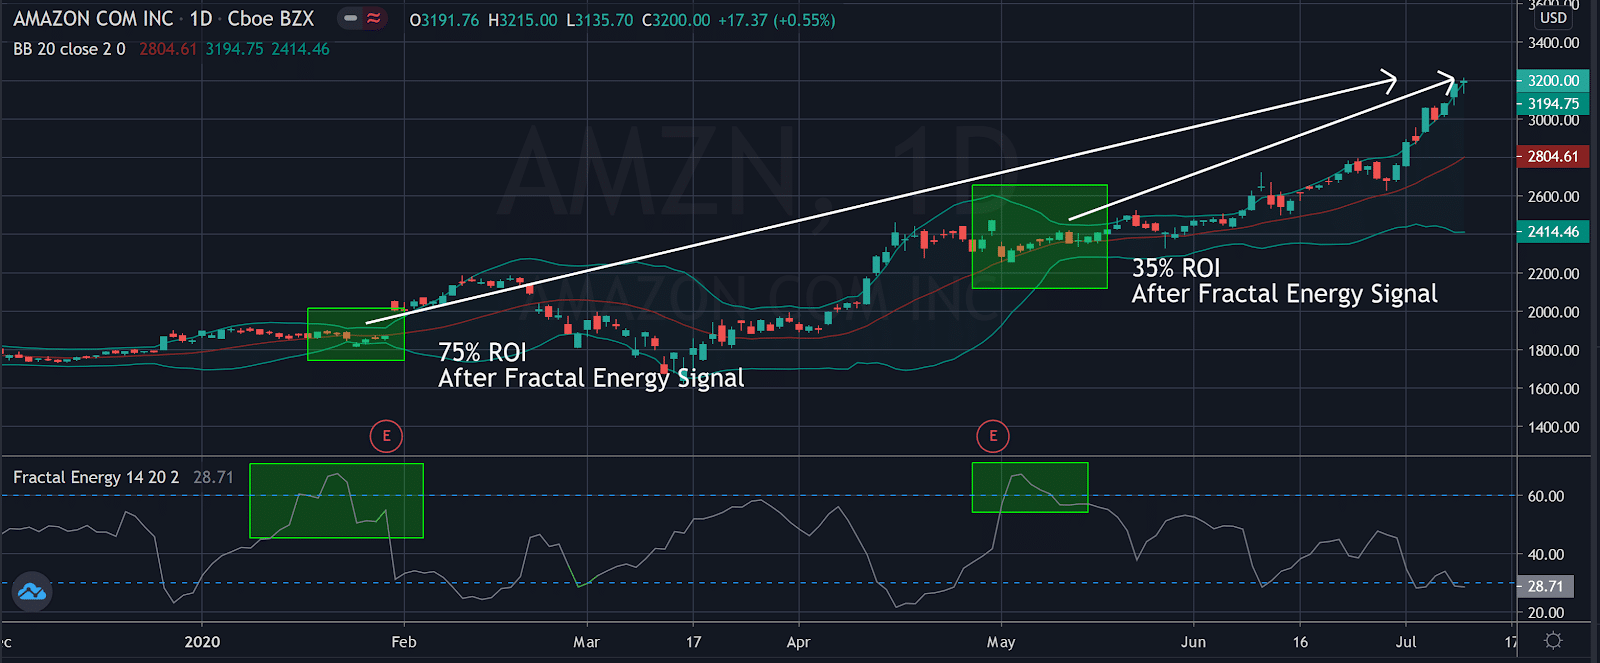
Source: Tradingview
Now even though there was a 75% ROI and 35% ROI seen after Fractal Energy signaled.
But, it’s not wise to buy a stock every time you see a low reading on the fractal energy indicator!
Why?
Let’s take a look at multiple time frame analysis.
Combining Fractals With Multiple Time Frames
Here’s an example why you want to combine multiple timeframes with the fractal energy indicator as well.
In CMG, if we bought on the daily timeframe the first time fractals broke their lower bands, we would have been left with being stopped out of the trade.
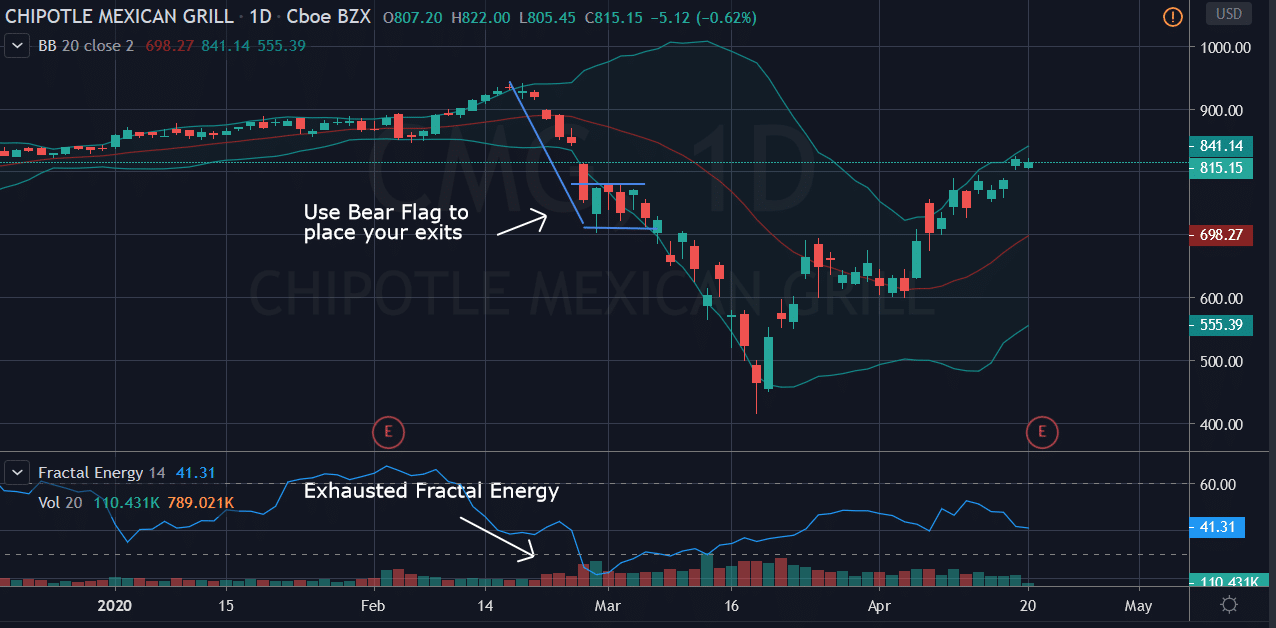
Source: Tradingview
But suppose you did in fact buy it, then it would be best to play the bear flag that was formed as your signal to exit at the break of the lower support level before the stock plunged lower
Not a very good trade right?
Now let’s take a look at what you might see if you used multiple time frame analysis:
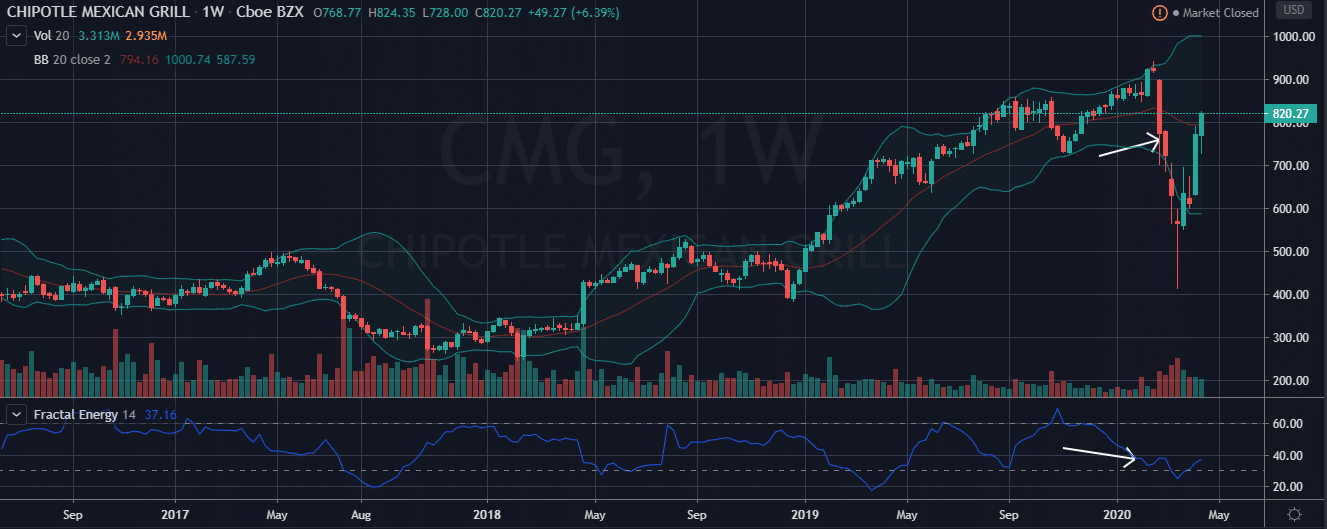
Source: Tradingview
You were actually buying on a weak candle and the fractal energy was not yet depleted yet!
And without the support of the higher timeframe to make the price rally, you ended up buying into a stock that kept falling.
Combining Fractals With Other Technical Analysis Tools
Now if you were to wait for fractals to show totally exhausted readings and combined that with a horizontal support level you were able to pick that “V” bottom almost perfectly!
Here’s what I mean…
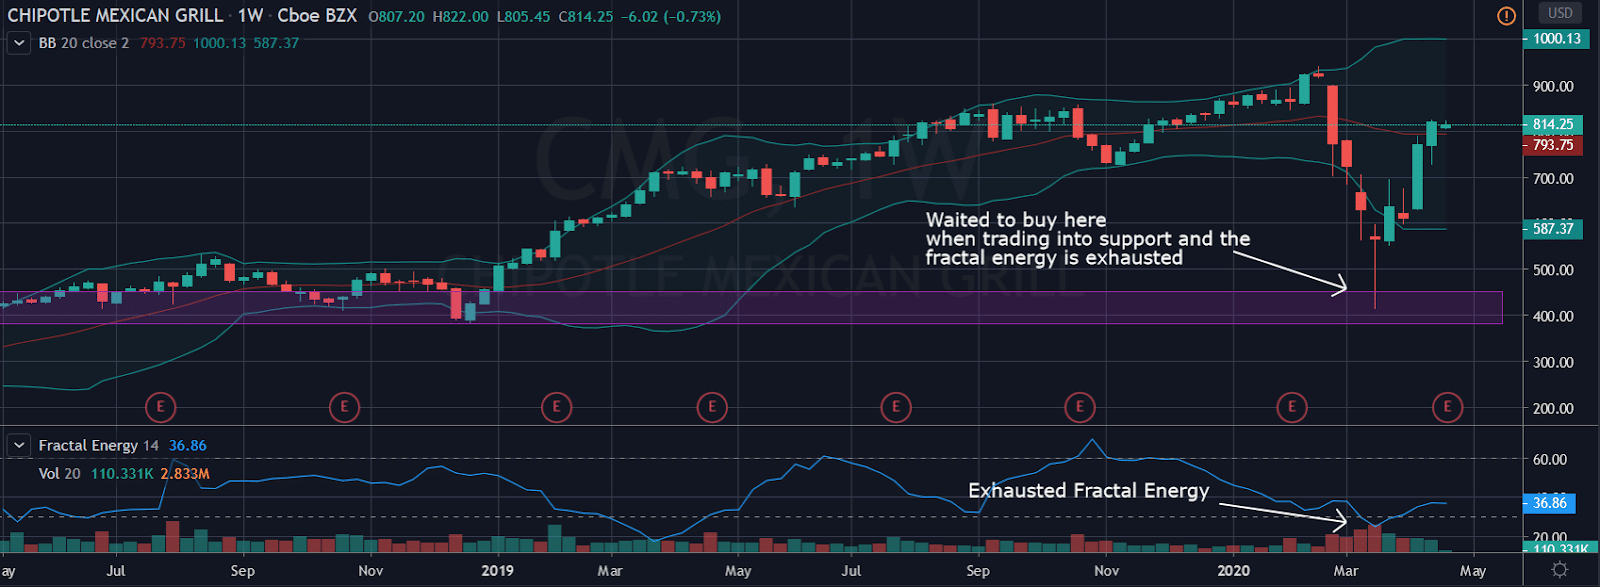
Source: Tradingview
Now that the higher time frame has exhausted fractal energy, combined with horizontal support levels, CMG decided to bounce and head up again!
So, even though a single indicator said to buy a stock, it is best to look for confirmation signals by combining fractals with known patterns and other technical analysis techniques.
The Double Bottom
For example, let’s take a look at the famous 52-week lows. Everyone has heard about stocks trading at 52-week lows and generally are considered to be “weak” or bearish when it comes to an investment.
Even though it’s common that many investors use the 52-week low to reference weak stock, as a technical trader, I actually consider this to be a bullish pattern instead.
Now, let’s take a look at what a double button as a 52-week low pattern
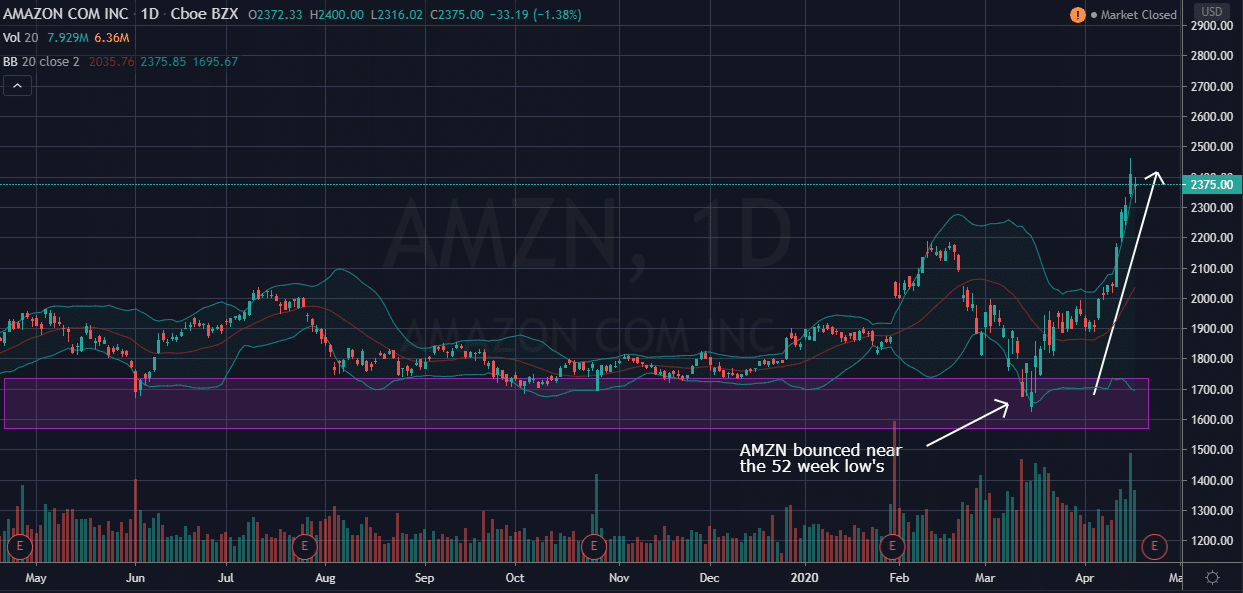
Source: Tradingview
So, as a technical trader, this is a pattern that I keep an eye out for as a BULLISH pattern and not a BEARISH pattern.
What’s so special about a 52-week low anyway?
Well it’s a technical pattern and this happens to occur throughout the stock market time and time again as traders look for patterns to buy stock.
Pro tip: Make sure you get out if the 52-week doesn’t support the price. Without a price floor to find support, the stock will continue to fall and it’s difficult to find the next area of support.
Wrapping Up
As a trader it’s common to get “tunnel vision” when you are focused on a single chart.
Before you know it, you start seeing things that you never saw before. Chart patterns morph into shapes, and you trick yourself into seeing anything that supports your trade idea.
But if you use these tips to your advantage you can get an advantage and head start trading on some of the markets largest moves.
If you kept an eye on the markets for fractal patterns, the trade in CMG rallied 50% from the breakout levels on fractal buy signals.
So don’t miss out as the Fractal Energy indicator continues to pick trades just like this every week!
Click here to sign up to Options Profit Planner now!
0 Comments