When it comes trading, there is one thing you cannot afford to get wrong…
And that is when you enter a trade.
Enter at the wrong time and you are guaranteed to have a loss on your hands.
But without an understanding of what indicators are used for, you just end up guessing at what to trade
But it doesn’t always have to be this way…
When using the right combo of indicators, you can really stack the odds of winning in your favor
And even though sometimes you end up with a losing trade, the chances of winning are far higher.
So let me show you why it’s important to have Bollinger Bands in your tool chest for picking stocks each day.
Bollinger Bands
Bollinger Bands were developed by John Bollinger as a price envelope designed to define the upper and lower price range of a stock.
Bollinger Band Indicator consists of a middle Simple Moving Average (SMA) along with an upper and lower offset band. Since the distance between the bands is based on statistics, such as a standard deviation, they adjust to volatility swings in the underlying price.
How do you read them?
Bollinger Bands help to determine whether prices are high or low on a relative basis, and according to these calculations, price should fall within range 95% of the time!
Let’s take a look at an example chart.
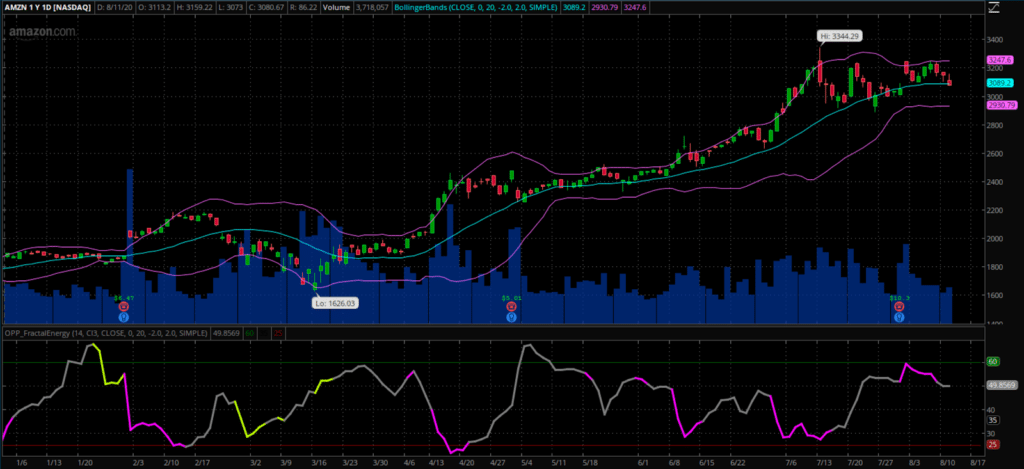
Source: Thinkorswim
You may have noticed right away that price tends to fall inside the Bollinger Band nearly every single trading day with very few actually making it outside the two bands.
And if the price did trade outside of the bands, the stock made sure to rebound quickly to get back inside of it.
How this indicator works:
- When Bollinger Bands tighten, there is a high likelihood that price will have a sharp move
- When the bands separate by an unusually large amount, this is showing a significant increase in volatility or a gap in stock price.
- The stock price can exceed and even hug or ride the band price for extended periods of time.
- Price has the tendency to bounce within the bands’ envelope, touching one band and moving back towards the other.
- You can use the middle SMA or opposite band as target prices and exits for your trading
- If prices move outside of the band, it’s expected to see a trend continuation until the price moves back inside the band.
Let’s take a look at this chart closer…
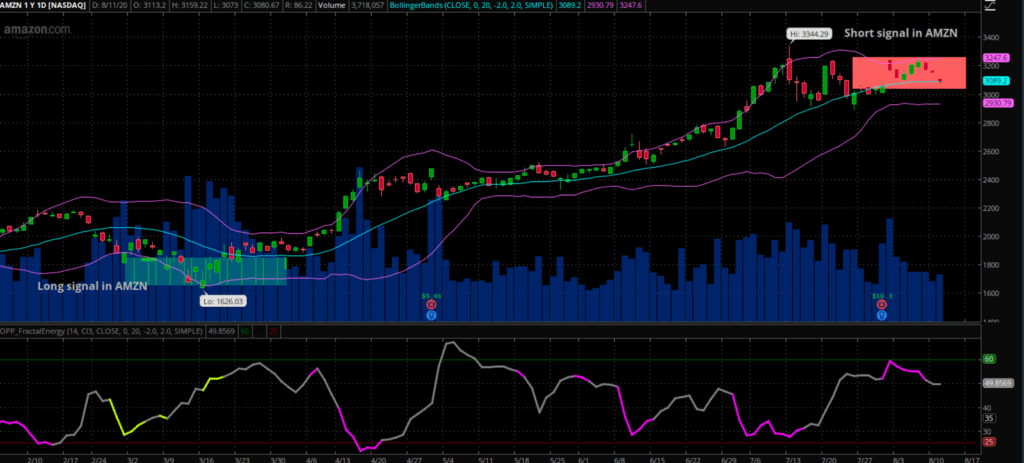
Source: Thinkorswim
Here you can easily see exactly the many signals the Bollinger Band will give a trader from the items that were listed above.
In a quick glance the trader will see :
- Tightening of bands can lead to breakouts
- Stock trends higher, riding upper band
- Trader can buy the moving average the entire way up if they are aggressive
- Price drops suddenly below lower band and snaps back inside the next day acting as a price barrier seen at the Long Signal
At this point, the AMZN trade is ready to come off and take profits on the Credit Put Spread that was traded for a nearly 100% winner!
Now… Why is there a short signal highlighted in AMZN?
Well…
The Fractal Energy and the Bollinger Bands have never been in alignment to set up a short position until recently.
This could be due to many factors, but the magenta line color signals to me that Fractal Energy is ready to decrease and entering an area for a selloff while prices are lingering above the upper Bollinger Bands.
So, how let’s take a look at Fractal Energy and Bollinger Bands when applied to the SPY’s chart
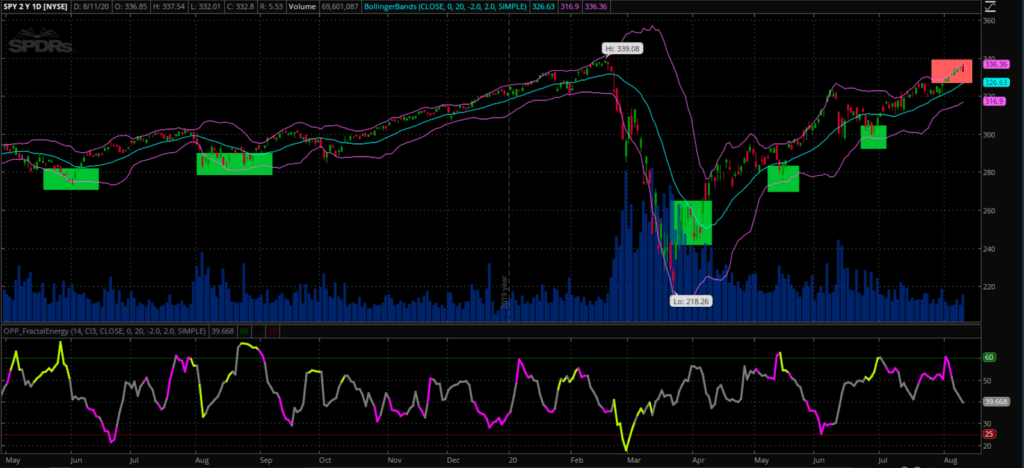
Source: Thinkorswim
Let’s break this down further:
- Bollinger Bands gave 5 entry points for longs highlighted in all of the green zones
- There was a period of time where the market was in a sell-off and we would have ignored the Bollinger Bands
- When uncertain of a stock’s direction, focus on how the Fractal Energy is behaving
- When Fractal Energy finally became exhausted, now you start looking for a long trade based off of a Bollinger Band signal (in this case, the middle moving average instead of the bottom support channel)
Putting it all together
I know this market is crazy… you have to trust the tools you use in order to trade safely.
And those tools are the Bollinger Bands and Fractal Energy Indicator.
When they are combined, they really are one of the best strategies a trader can deploy in markets that are unpredictable.
When looking at these two indicators, this is where statistics and probability really shine and make for a highly profitable trading opportunity. And to make it even better, I combine selling options and spreads to put the house odds in my favor for every trade!
Which means not only do I trade using two battle-tested indicators, I combine these with a credit trading options strategy that can pay me 100% ROI on my trade if timed correctly to the markets.
0 Comments