Let me cut straight to the point…
If you’ve got so many indicators on your charts where it looks like spaghetti or pick-up-sticks…
You’re doing this technical analysis thing all wrong.
But that’s ok…
It’s probably because you haven’t learned how to leverage the power of these indicators in a way that makes trading clear and concise.
Now let me show you why I focus exclusively on two indicators to give me the edge I need
The edge that lets me take down 50% winners on a weekly basis.
Options Profit Planner
Options Profit Planner is a system that is designed around key technical analysis and indicators that allow me to find an edge in the markets.
Once I find my trades, I then put the odds of the casinos to work for me by selling options and leveraging credit spreads.
Now sometimes I bite off more than I can chew but that’s ok! It’s important to make sure you have a back up plan, for a back up plan, for the main plan.
But trading smartly is what keeps me in the game.
And if I need to end up owning the stock, I am ok with that!
Since I only trade stock I feel comfortable investing in to start with.
Now before we get into credit spreads and what they are, let’s take a look at what technical indicators I use on a daily basis to find my trades.
Fractal Energy
Fractal Energy is the cornerstone indicator of Options Profit Planner and its power is used to pinpoint key market reversals.
The power of fractals allows me to determine the strength of trends and how much “life” is remaining in a stock’s movement.
There are 2 main components of Fractal Energy:
- Fractal Pattern
- Energy
And when you use the power of this indicator you will be able to successfully determine the strength or weakness of trends on any stock.
Let’s take a look at how Fractal Energy changed the way I look at stocks.
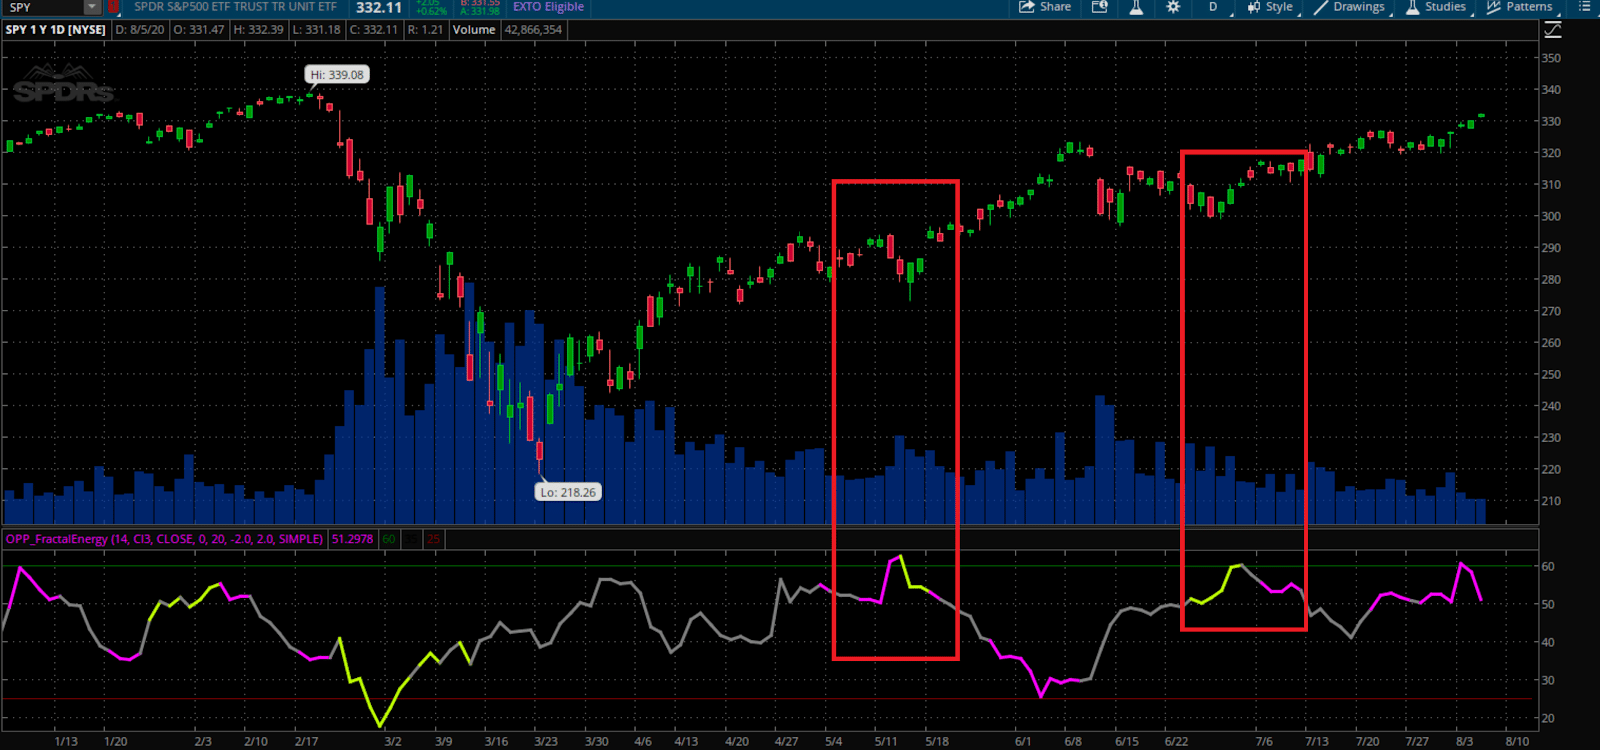
Source: Thinkorswim
Here’s what I’ve spotted with the Fractal Energy on the SPY and how to use this to time the entries my credit put spreads
When the Fractal Energy becomes fully charged with a reading over 60, it’s showing that a stock is ready and “charged”
Then once it’s charged, the stock is ready to make a move.
But you see, the largest problem is knowing the direction it’s going to take.
Since the Fractals only tell you if it’s charged or exhausted, you don’t quite know the direction of the outbreak that’s coming.
And that’s where I turn to Bollinger Bands to help give me the direction it should break out in.
Bollinger Bands
For anyone who is unfamiliar with Bollinger Bands here is some background information to learn how this indicator can help you time the markets with superior accuracy.
Bollinger Band Indicator consists of a middle SMA along with an upper and lower offset band. And because the distance between the bands is based on statistics, such as a standard deviation, they adjust to volatility swings in the underlying price.
How do you read them?
Bollinger Bands help to determine whether prices are high or low on a relative basis, and according to these calculations, price should fall within range 95% of the time!
How this indicator works:
- When Bollinger Bands tighten, there is a high likelihood that price will have a sharp move
- When the bands separate by an unusually large amount, this is showing a significant increase in volatility or a gap in stock price.
- Price can exceed and even hug or ride a Bollinger Bands prices for extended periods of time.
- Price has the tendency to bounce within the Bollinger Bands’ envelope, touching one band and moving back towards the other.
- You can use the middle SMA or opposite band as target prices and exits for your trading
- If prices move outside of the band, it’s expected to see a trend continuation until the price moves back inside the band.
Now let’s first take a look at how the same Fractal Energy reading looks when it’s combined with Bollinger Bands.
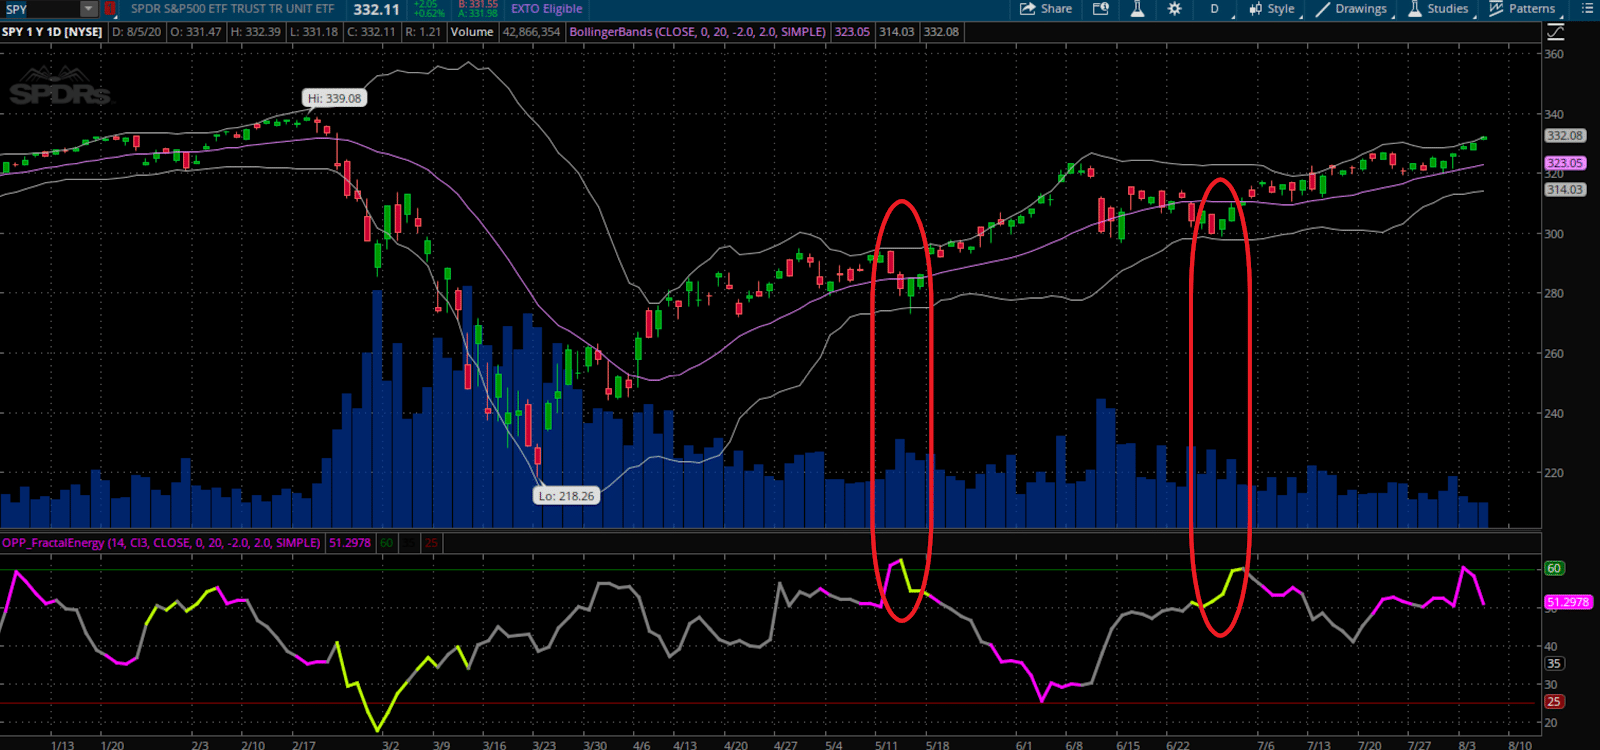
Source: Thinkorswim
Now that Bollinger Bands are combined with Fractal Energy, you can easily start to identify which direction things are going to start trading in.
And after each one of the signals, the SPY’s ran for the next few weeks afterwards..
A review of what you will find in Bollinger Bands:
- Tightening of bands leads to breakout
- Stock trends higher, riding upper band
- Trader can buy the moving average the entire way up
- Price drops suddenly below lower band and snaps back inside the next day acting as a price barrier
Credit Spreads
Credit spread strategies make you money while debit spread strategies cost you money.
And when you are a business owner, you want money coming in and not going out.
But that’s not the only thing that separates the two types of spreads.
A credit spread involves selling a high-premium option while purchasing a low-premium option in the same stock and option type.
A debit spread involves purchasing a high-premium option while selling a low-premium option in the same stock and option type.
The Credit Put Spread
Let’s take a look at an example of a credit spread on SPY to place the long/neutral biased trade.
First, when trading a put credit spread you will want to focus on the right-hand side of the options chain.
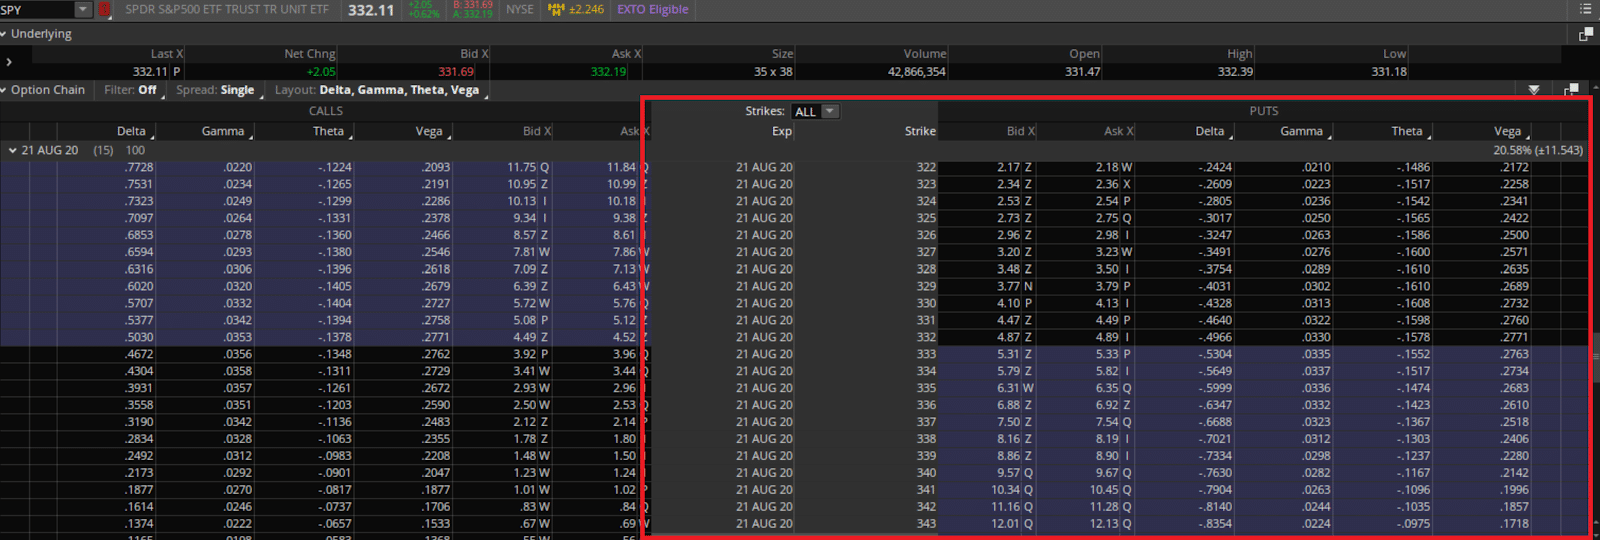
Source: Thinkorswim
Now that we are looking at the options chain, we want to create a credit spread instead of a debit spread.
This means we want to sell the more expensive option (closer to in the money) and buy an equal amount of the cheaper (further out of the money) option.
Now let’s take a look at a sample trade.
Credit Put Spreads:
Sell 10 x 21 AUG 20 $330 put
Buy 10 x 21 AUG 20 $320 put
Max reward: $2.22
Here is the risk profile of this credit put spread.
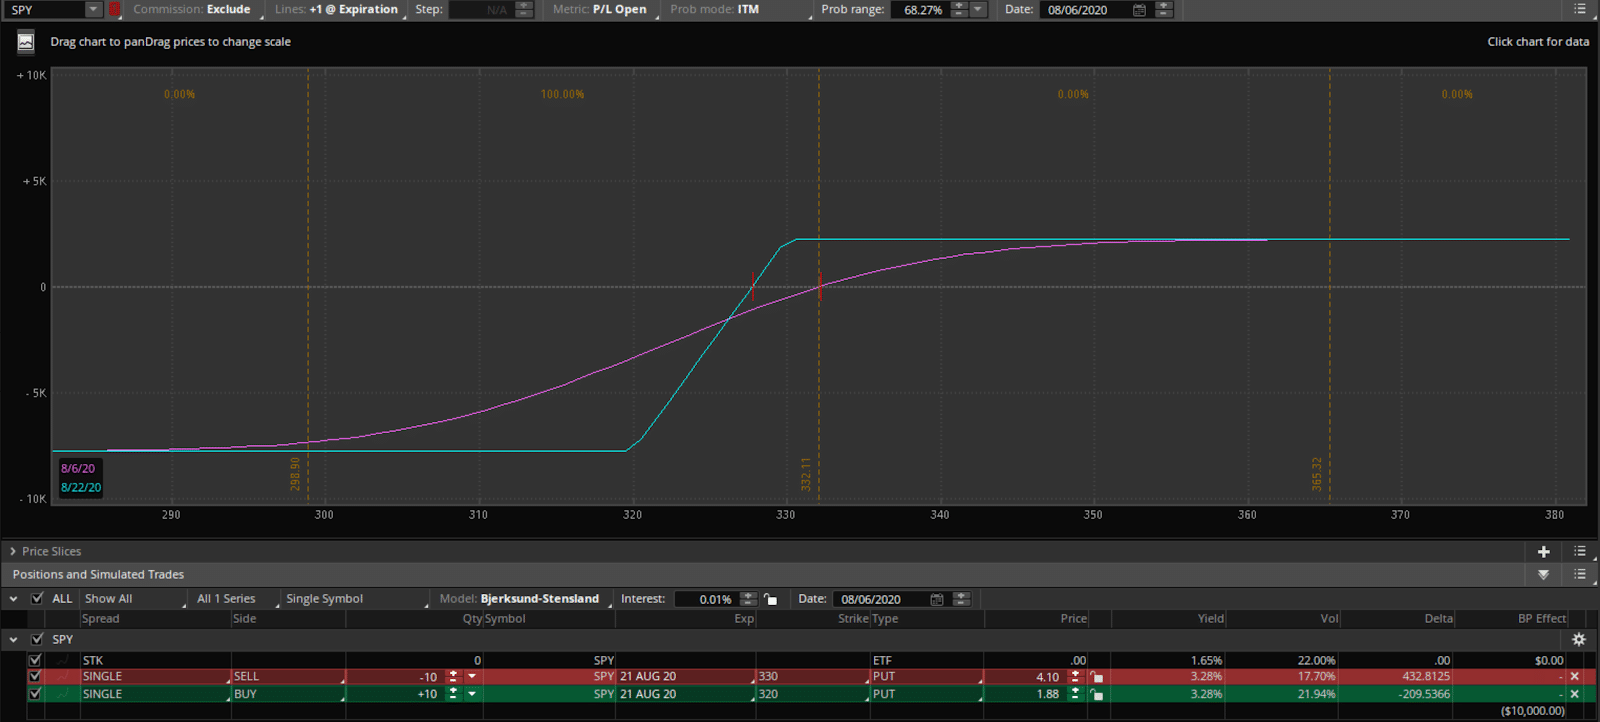
Source: Thinkorswim
From the chart above you can see that if the stock stays above its breakeven, you will see a return on your trade. And if the stock stays above the upper strike, 320, you will collect max profits.
Wrapping Up
When trading with Fractal Energy and Bollinger Bands, a trader can start to easily find market reversals or a “Buy the Dip” type of trade.
A trade that can put a trader in a position to generate significant income from selling puts or credit spreads.
By selling puts or a credit spread, the trader will make full profits by the options expiring with little or value.
Credit Spreads involve selling a high-premium option while purchasing a low-premium option in the same class or of the same security, resulting in a credit to the trader’s account.
Credit spreads give unique advantages to traders when trading credit spreads, with the most important being that you are paid upfront to place a trade!
Additionally, the put seller will be able own the stock at their desired levels and turn this position into an investment.
And once they own the stock, the trader will be able to ride the price higher after the selloff is over.
And that’s why Fractal Energy is the cornerstone indicator of Options Profit Planner!
Click here to join Options Profit Planner today!
0 Comments