Sometimes when you can’t find a stock to trade you cycle through your usual suspects…
And then you probably end up placing trades even if you don’t have an edge
Unfortunately, that’s not trading… but instead gambling!
So how do I make sure to stay away from gambling but instead trading with an edge?
Now how do I select my trades anyways?
By leveraging technology to help remove the guesswork.
And I do this every day with a simple set of tools.
Just give me a few minutes and I’ll explain to you how it’s possible.
Filtering The Markets
In order to filter the market – a trader needs to have a winning pattern that they wish to locate.
And when looking for stocks to trade, guessing is not the right thing to do as it can lead to disaster.
For example, it is not recommended to apply a filter such as, price > 0.50, or price < 10,000 as you will not do much in terms of actual filtering.
Typically, what you would want to do is filter out stocks that are much more specific to your style of trading.
For example,
- Price > 20
- Avg Daily Volume > 200k
- Technology stocks Only, No ETF’s
- Earnings this month
In this case, I only want to see stocks with a specific price, volume and excluding ETF’s from the list.
Now there would be no way to find those stocks without software.
As a trader, you need to make sure to cut down the 20k stocks down to a couple handfuls to make it a worthwhile filter.
Now I don’t have time to scan through that many stocks by hand every week.
Instead, when applying these filters to a software package, you can get a head start on your next trade.
Here’s an example of applying those filters to the markets.
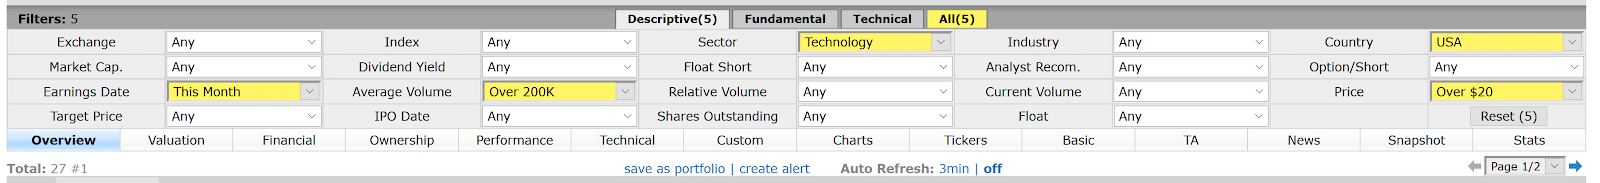
Source: Finviz
As you see, this reduced almost 20k stocks down to 27 total to choose from
Now that’s a far more manageable list to review every week.
Now let’s take this one step further and look at some ways that I filter for stocks that give me the best shot of landing a winning trade
Applying “Hands On” Filters For Credit Spreads
So, do you see the power of filtering down your stocks?
Even though I just said it’s important to get the lowest number possible on your scanner… that’s not always true.
You need the best filters to get your stock list lower that represents your trading strategy.
Sometimes there is nothing you can do but have to manually sort through 200 or more names.
Now let’s look at a few examples that you can use to find great setups to sell credit spreads around.
Support and Resistance
One way to manually filter stocks that a scanner like Finviz can’t do is by using the naked eye.
And one pattern that I love to look for is stocks that are trading on a technical level, called support.
In order to trade credit spreads that have a high probability of being profitable, I need to find stocks that are trading at or near these support levels.
Here is an example of this working in a popular stock,
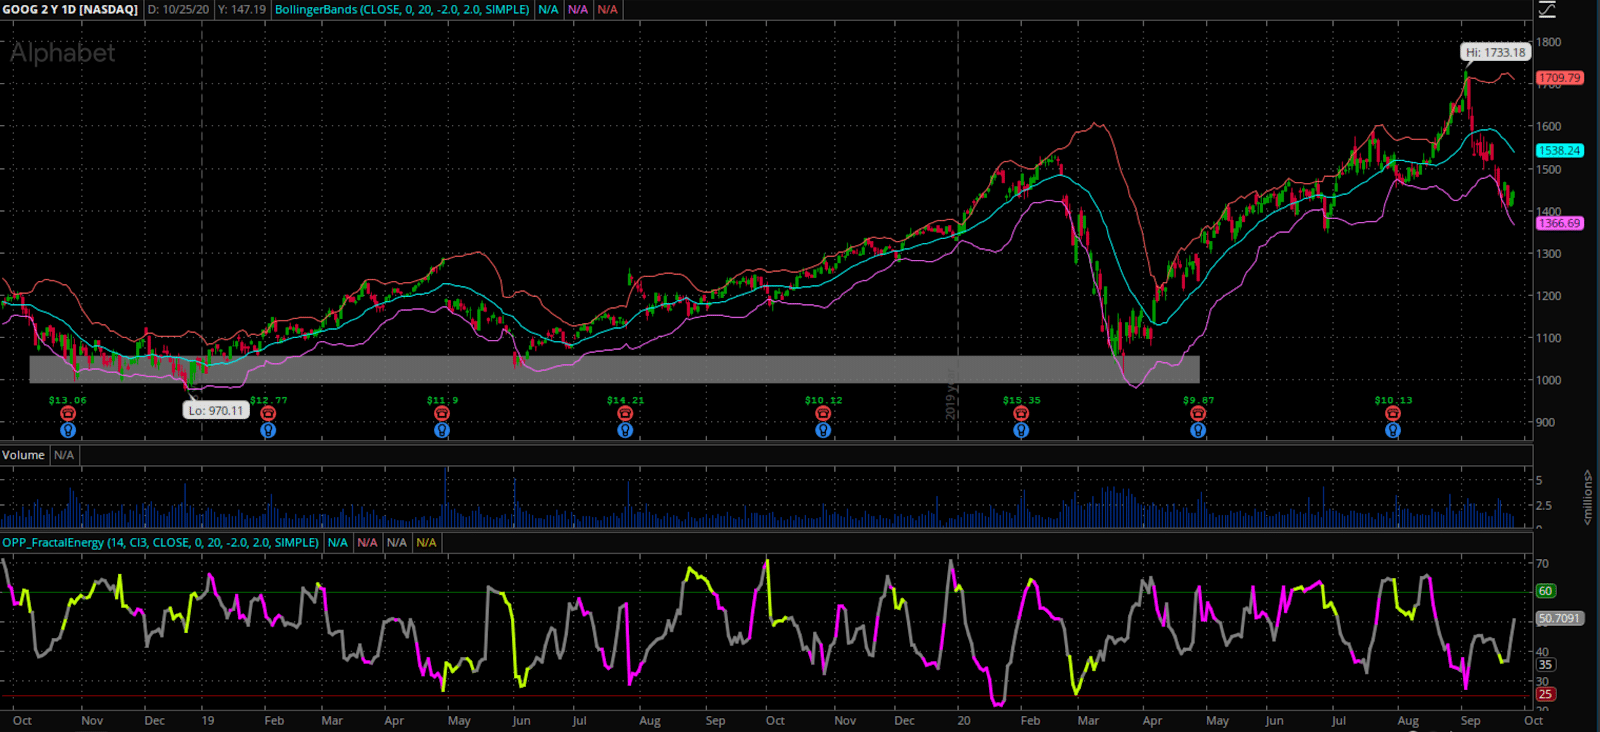
Source: Thinkorswim
As you can see, GOOGL price bounced off of the support zone and went straight to all-time highs shortly afterwards.
And even though there were little wiggles throughout the last year, no move compared to the price bounce seen at the technical support levels from the prior year
Pro Tip: For my own trading, I would like to locate a longer-term area of support that is supported by the stock trading into the 52-week lows.
The Bollinger Band Support Pattern
Now, the 52-week (1 year) or 104-week (2 year) lows tend to be extremely strong support levels…
But other important support levels can influence an active trader instead of waiting for those major levels.
One type of these support levels is when traders utilize Bollinger Bands for support instead of major price pivot levels.
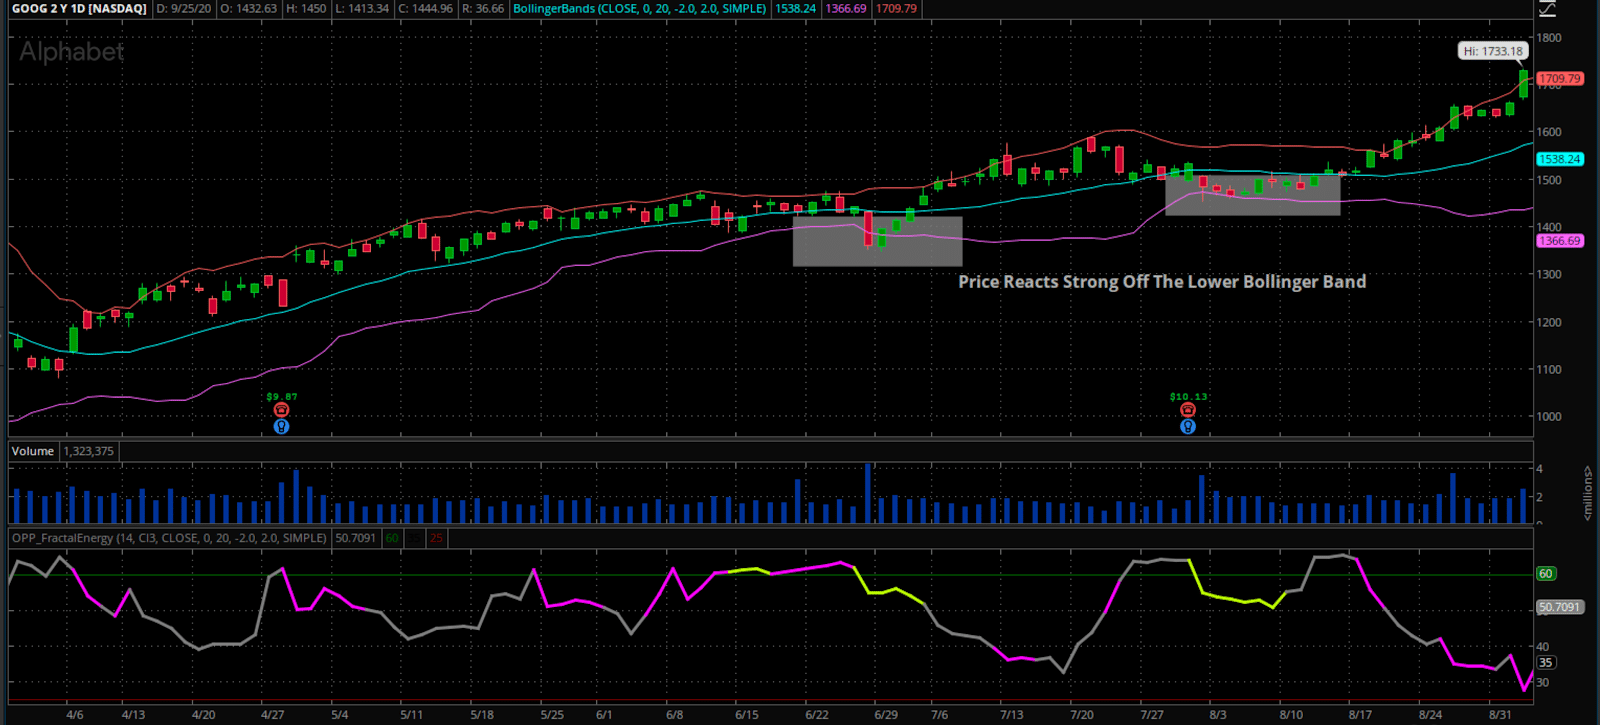
Source: Thinkorswim
Here’s another example of the major pivot low for comparison that caused a V-bottom in CMG
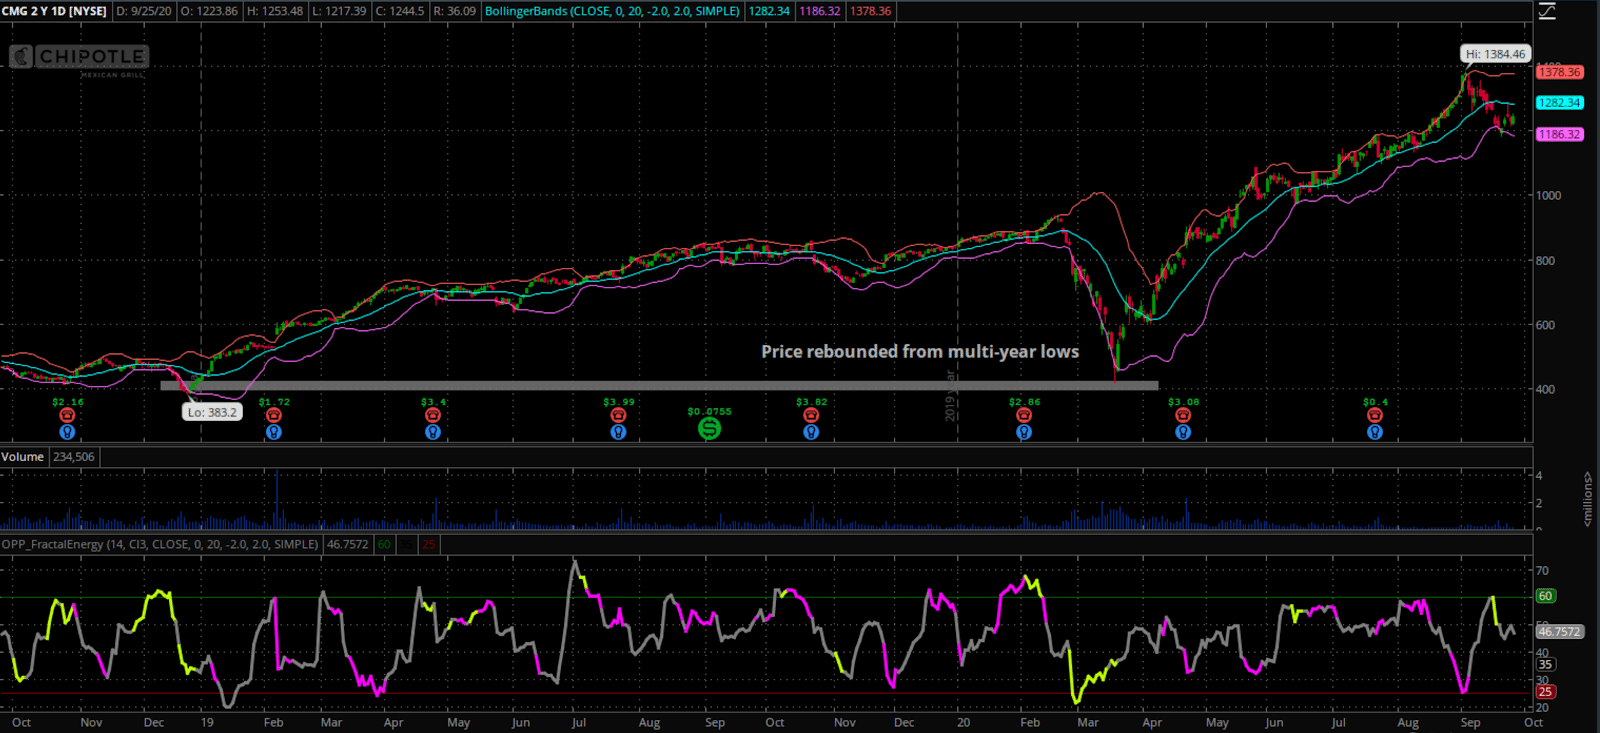
Source: Thinkorswim
But who wouldn’t want a piece of that action when the CMG traded at that huge of a discount? I sure know that I would!
Pro Tip: When selecting this pattern, make sure the lower lows are increasing to confirm the bear flag is not taking over. Here is an example of this
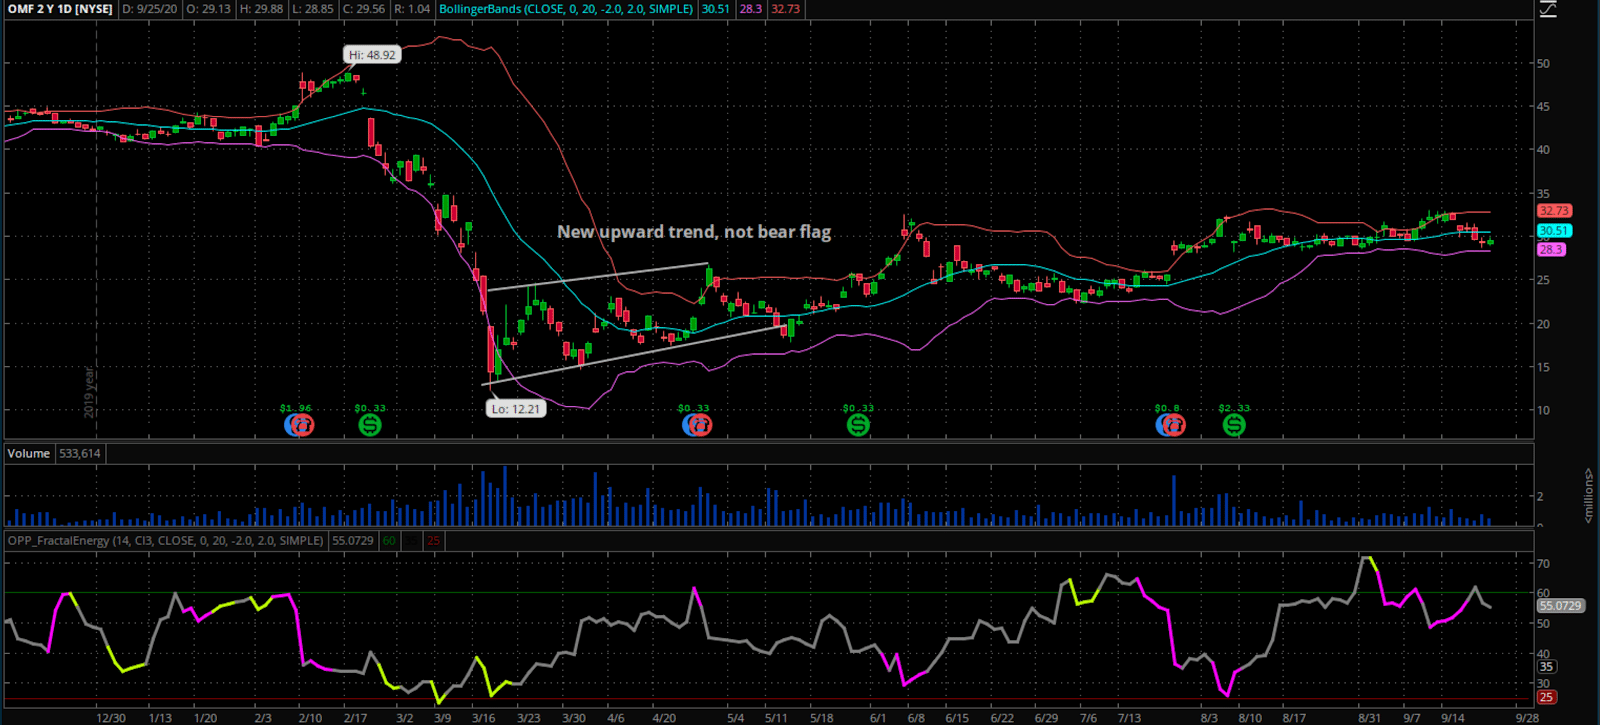
Source: Thinkorswim
So… now that you understand why it’s important to pick good stocks that are trading at or near support levels, there are many additional filters you can use to find stocks to trade.
Additional Filters
If you are interested in using more filters than those few described, feel free to experiment with what works best for you.
Some additional popular filters are narrowing down a stocks sector, industry, earnings, fundamental, or insider ownership transactions.
Some of the most popular filters are:
- Fundamental fiters
- Price and volume filters
- Insider transactions
- Short floats
- Earnings dates
And just as you used filters to narrow down the stocks that met those specific fundamental criteria, there are ways to filter more technically as well…
Some ways to filter down stocks even further are:
- Filter stocks with prices above their moving average
- Uptrend breakouts
- Downtrend breakouts
- Patterns with increasing volumes
- Prices near support or resistance
Summary
With a few steps and basic filters, you can effectively reduce thousands of stocks to a smaller qualified list that meets your specific criteria.
The goal?
To pick the stocks that align with your market outlook so you can make a more objective decision about what and when to trade.
There are also some various free tools that are available for you to use on the web. One of my personal favorites is FINVIZ which I use to screen for my perfect trade.
Click here to learn more about my Options Profit Planner system today!
0 Comments