Historical volatility, Implied volatility, greeks…
There is too much to keep track of when it comes down to getting started.
But the more advanced you get and the more money you decide to pour into your options account, the better you’ll be enhancing your knowledge beyond the basics.
One of the most critical concepts to learn in all of options trading is Implied Volatility.
But it’s more than just a concept. It’s an essential ingredient in the options pricing model.
If you catch yourself on the wrong side of volatility and it can be a disaster. However, when you’re on the right side of the volatility trade, profits can be big and come in fast.
Today’s lesson is about getting you familiar with implied volatility, and how it affects everything we do with options.
Implied Volatility – Overview
Implied Volatility represents the expected volatility over the life of the option contract for the specific stock.
As excitement rises and falls, implied volatility will increase and decrease the value of the options contracts.
Options that have a high level of implied volatility will result in high priced or overpriced options premiums.
Alternatively, options that have a low level of implied volatility will result in a lower price and possibly underpriced options premiums.
If you owned a stock when implied volatility increases, the value of these options will also increase. And the same happens if implied volatility decreases, the value of these options will also decrease.
When looking at the options chain, each listed option has its own unique sensitivity to implied volatility. This is called Vega.
For example, a shorter-dated option contract will have less impact on implied volatility than a longer-dated option contract.
Each strike price will also respond differently to implied volatility changes. Options with strike prices ATM are the most sensitive to changes in implied volatility, while options that are further ITM or OTM will have less sensitivity to implied volatility.
How to use Implied Volatility
One effective way to analyze implied volatility is to examine a chart of stocks with implied volatility.
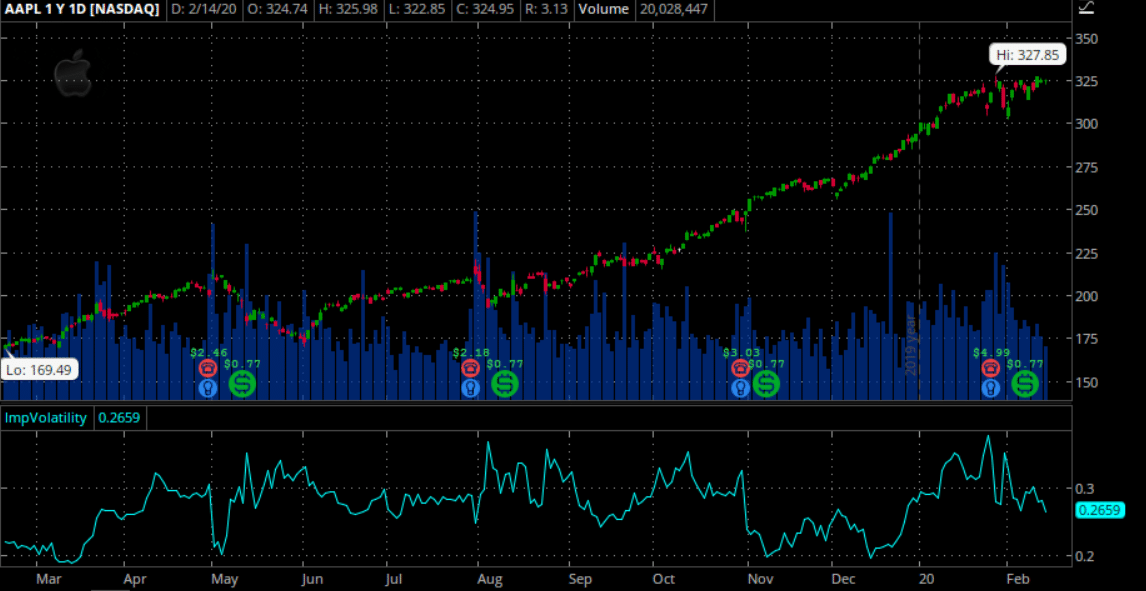
For example, if you look at the chart of 52-week chart of IV on AAPL, you can immediately notice two things.

What stands out:
- Spikes in IV align with larger bar movement of the underlying stock.
- IV Ranking is range bound and lets you quickly identify overbought/oversold zones.
Because each stock has a unique implied volatility range, these values are not to be compared on another stock’s volatility.
Using Implied Volatility to determine a strategy
You’ve probably heard the term, buy low sell high… and there is no difference for IV…
Buy undervalued options and sell overvalued options.
Now I know it might be sounding too complex but it is much easier than you would think.

In this chart, you can see Theta, or the value added by increased volatility on AAPL.
Four Things To Consider
- Make sure you can determine whether IV is high or low prior to getting into a trend reversal trade. Remember, as IV increases, options prices are becoming higher.
- If you come across periods of high volatility, it is most likely caused by some external force. It’s best to check for reasons that may be causing IV to be elevated, such as mergers, earnings or other announcements.
- When you see options trading with high implied volatility levels, it’s best to target option selling strategies. As options premiums are elevated, it’s best to avoid purchasing options and it might be more desirable to sell. Some strategies are covered calls, naked puts, short straddles, and other various credit spreads.
- When you see options trading with lower Implied Volatility levels, it’s best to target option buying strategies. As options premiums are suppressed, it’s best to purchase options instead of selling options. Some strategies are buying calls, buying puts, buying long straddles, and other various debit spreads.
One way to trade implied volatility is through a strategy called Mean Reversion. Let’s take a look at that closer.
Next..
What is Mean Reversion?
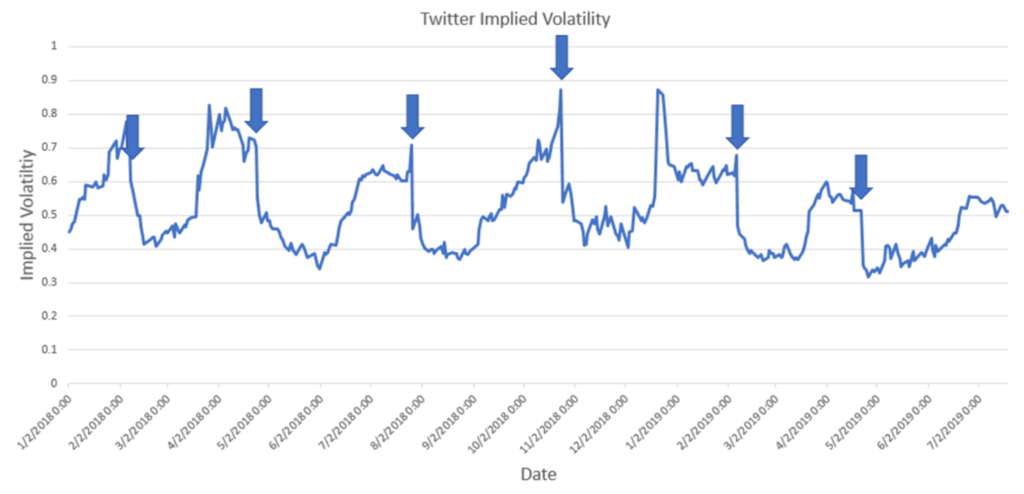
Implied volatility has a mean-reverting tendency – meaning there are periods when it moves away from its historical average and then reverts back to the average.
A reversion to the mean involves retracing any price back to a previous average. In options, it is thought that as price strays far enough away from its longer-term norm it will revert back to an average value.

In this example above, you can easily see the 6 points where implied volatility spiked and relative to historical values suggested that it should revert back to its long-term average.
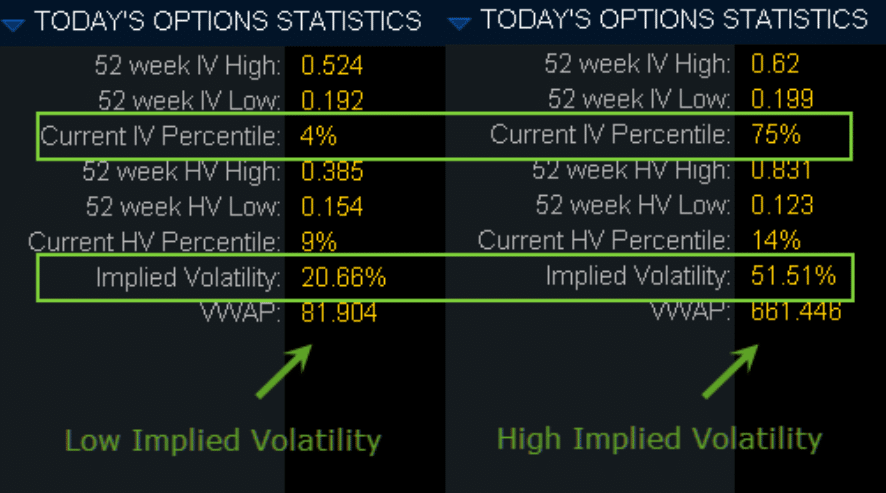
Another way to determine low vs high IV levels is to use a built-in statistics tool found in Think Or Swim (Make sure to check with your respective brokerage for their IV statistics).
As a general rule, some traders will sell credit spreads when IV is between 67% and 100% percentile of its 52-week range.
Key points:
- Mean reversion suggests asset prices and historical returns revert to long term average levels
- Mean reversion has led to many investment strategies in options trading
- Mean reversion tries to capitalize on extreme changes in the price of a security, assuming it will revert to a previous price.
Wrapping Up
There are many reasons an options implied volatility may deviate from its averages. Some examples include upcoming earnings announcements, fed announcements or an upcoming merger and acquisition.
The key is to recognize when implied volatility is high compared to its historical highs. When it appears to be extended compared to past values, options traders should structure a trade accordingly.
The process of selecting option strategies, an expiration month and strike price, things can start to get complicated very fast.
But one factor you never want to overlook is Implied Volatility on that stock.
It is wise to always gauge the impact of what IV has on selecting your strategies.
There are a few things to remember about implied volatility:
- Bearish markets increase volatility
- Bullish markets decrease volatility
- Implied Volatility is a proxy for emotions of the underlying market and can be erratic
- It’s possible to align the underlying stock direction to the IV level to combine stock movement with shorting IV
- Implied volatility trading comes with built-in entry and exit prices for your trade.


0 Comments