Here we go again… traders are bracing for impact as the markets spiral towards the ground in a free fall.
While many will crack, making poor decisions under pressure, others will tighten their grip and trade out this mayhem.
In markets like these, there are many opportunities for traders to capitalize on fear and it comes down to two things… patience and discipline.
To calm nerves and make execution seamless a trader must have a trading system or custom indicator to handle the way stocks are selected and traded.
And it doesn’t matter if the markets are heading up, down or sideways… when trading options there is an indicator to help you make money!
So how do you do this?
It’s simple.
Be sure to use a tried and true market strength indicator that tells you exactly what to expect next.
How do I do this?
I turn to my custom indicator that taps into the inner markets and Fractal Energy of the stocks.
And this indicator has nailed the market top and bottom to almost the exact day of the reversal!
Today I’m going to explain to you how it works.
Fractal Energy
The Fractal Energy indicator is one of my cornerstone indicators when it comes to timing the financial markets.
This is one indicator that I use to determine the strength of trends and how much “life” is left in a stock’s movement.
Fractal Energy Indicator is broken down into two main components:
- Fractals
- Energy
By harnessing the power of both Fractals and Energy this indicator is able to determine strength or weakness of trends on any stock.
So how does this work?
Applying Fractals To Time The Markets
Recently we have seen some of the most intense volatility in the financial markets in the history of the stock market.
But that’s not the case with Options Profit Planner… but instead we have been crushing the markets left and right with perfectly timed put spread trades!
Now I bet you are wondering… How could this be possible?
It’s simple!
By using the Fractal Energy indicator I’ve been able to predict the market move down and the most recent bounce almost perfectly!
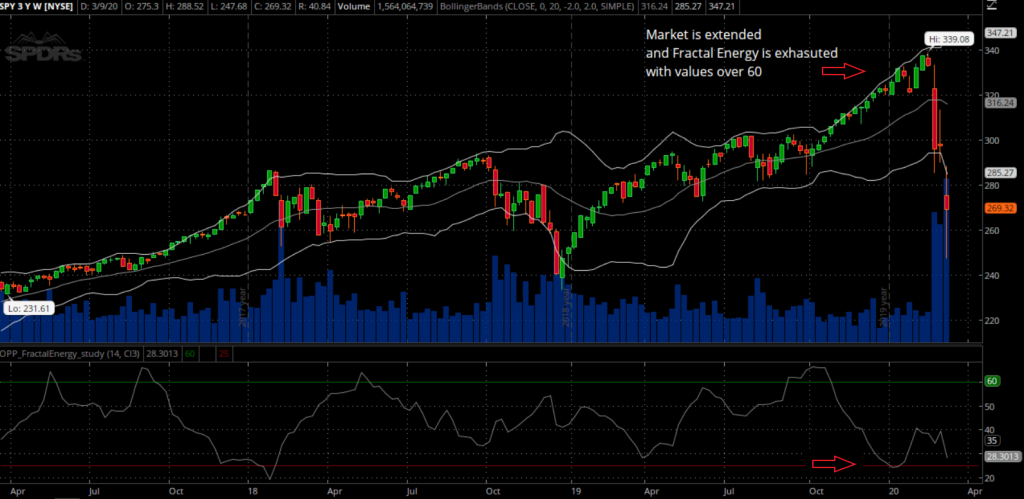
Let’s take a look at SPY’s when using this indicator plotted.

Source: Thinkorswim
Well, when the indicator is below the red horizontal line, it is considered to be “exhausted” in its movement and needs to “recharge” it’s fractal energy in order to continue moving in the original direction.
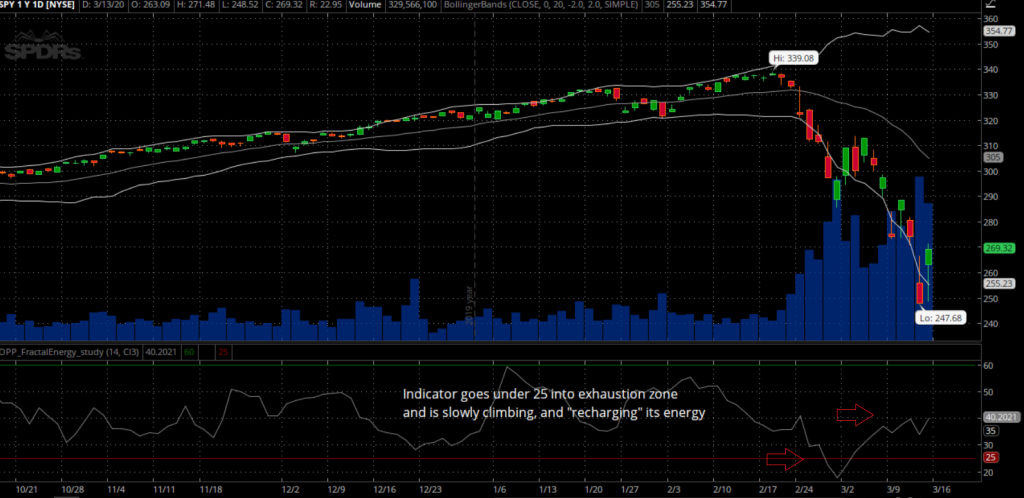
Now that we understand what the Monthly chart is reporting for Fractal Energy, let’s take a look at this indicator on the Daily time frame to see what it’s doing today.

Source: Thinkorswim
After looking at the Daily timeframe, there are two recent things that occurred with the Fractal Energy that signal a “build-up” of energy is occurring.
As the indicator dropped below the 25 value, it is considered to be exhausted from the downmove and a period of consolidation is needed before continuing in either direction.
And as the indicator rose back above the lower threshold, it is recharging the energy in the markets. This is needed before the market is going to be able to try and regain some ground that was lost in the past two weeks.
So what does that mean a trader can do?
Let’s take a look at a sample trading using my favorite option strategy to get long the stock market.
Next…
The Trade
Let’s take a look at a way to trade this stock going long without buying stock directly.
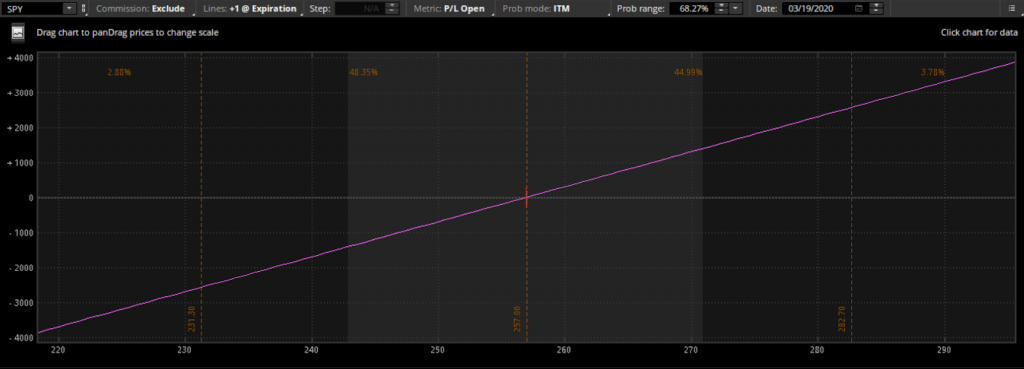
But for your reference, here is a risk diagram illustrating the risk of unlimited loss when buying a stock.

Source: Thinkorswim
So, as you can see above, there are significant risks associated with trading long stocks directly.
And with the markets moving 10% each day, I doubt anyone would want to buy a stock and watch their account flip that quickly on them.
The solution?
Trading a credit put spread on the markets to provide downside protection. Another benefit of trading a credit put spread is that the odds of a winning trade are greatly in your favor.
If a stock drops, goes sideways, or increases you can make money in this position!
Let me explain…
A credit spread is a directional strategy that requires a trader to buy an option that is at a nearby strike and sell an option that is at a further strike. Both in the same month and on the same stock.
This can be a highly advantageous choice instead of going long the stock directly… especially during extreme periods of high volatility like we are in now.
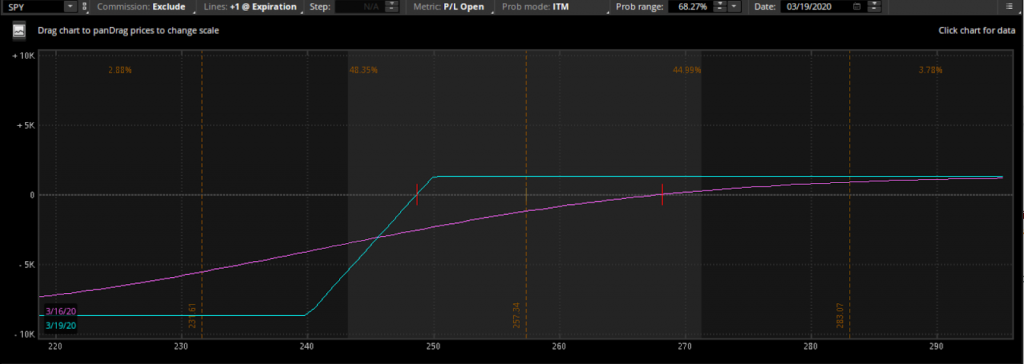
Here is an example of a credit put spread on SPY for your reference.

Source: Thinkorswim
As you can notice, this strategy offset all of the downside risk a trader will face. This strategy is known as a credit call spread and is placed as a neutral to bullish strategy for a trader to utilize.
The benefits of this strategy comes in 3 key points:
- Trade wins in a downward, sideways, or upward market.
- Paid upfront credit for this trade
- Limited downside risk
Wrapping up
Trading credit spreads is a great way to generate income and also eliminate any risks associated when going long a market in periods of high volatility or high risk trading.
Let’s take a look at some pros and cons to trading credit spreads and covered calls.
Pros:
- House odds in favor of seller (60% or more)
- Limited downside risk compared to long stock
- Can win in up, down, and sideways markets
- Lower capital requirements vs owning stocks
Cons:
- Limited upside gains
It’s easy to see how the pros of trading this strategy significantly out-weight the cons!

0 Comments