It’s that time of year again.
Where we get together with friends and family, eat and drink until we can’t move, then pass out while watching the Cowboys play football.
Some…will wake up early or stand in huge lines… fighting with the crowds… in hopes of getting the best possible Black Friday deal.
I get it… trading this week is probably an afterthought for you.
Don’t worry, I’ve got you covered, check out my holiday season market forecast below:
Holiday Season Market Forecast
Price action is the key factor to if the markets will trade back through its highs, and so far, I like the way it’s setting up going into the holiday week.
One possibility for the week is the markets may actually go sideways through Thanksgiving, waiting for a catalyst to spark the next move.
One catalyst is the economic numbers for the holiday season.
If consumers are spending big for Black Friday and Cyber Monday, we could have what we need to see markets at record levels.
Daily Market Forecast
I think it’s going to be quite an interesting week next week. This is mostly due to the prior week’s price action combined with decreased trading volumes around the holidays.
As anticipated, the SPY saw a little bit of the pullback followed by sideways price action off the top of the daily Bollinger Band.
This consolidation also aligns with the 9-period exponential moving average helping to support the price.
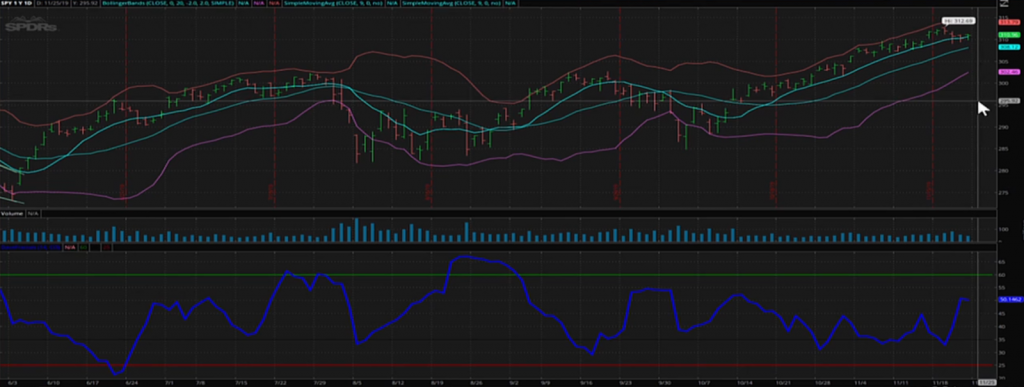
With those main factors, it’s looking like the markets have allowed the daily indicator to recharge back into the ‘50s or even higher.
Takeaway: All-in-all the daily chart looks promising for a move higher in the upcoming weeks.
Weekly Market Forecast
The daily chart is looking positive and starting to point towards higher levels in the markets.
Let’s take a look at the weekly chart to see if the higher timeframe can confirm what we see in the daily charts.
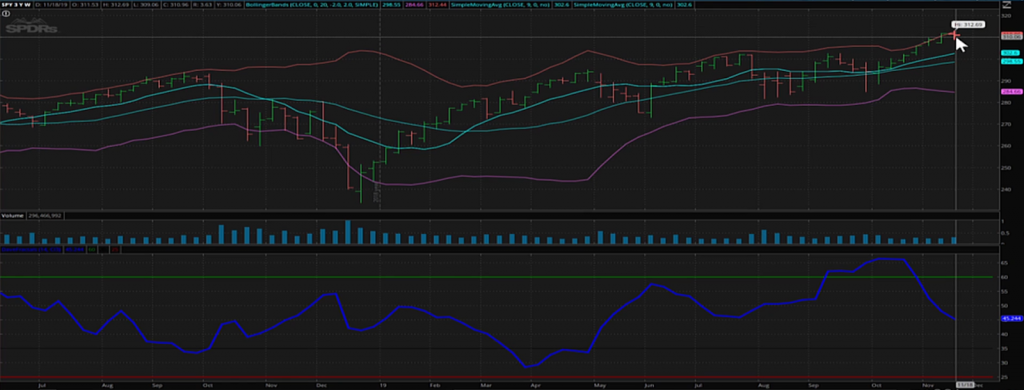
So far it seems are about half way through the move as the price continues to ride up against the upper Bollinger Band.
The indicator is slowly decreasing down to the 45 range and is still signaling there is market movement left to the upside.
I anticipate the indicator to get down into the 30 range before its fully exhausted and signaling a sideways or downward market for the upcoming weeks.
Everything so far is as planned with the markets taking a pause last week, allowing the daily indicator to recharge and the weekly prices to come off the top of the Bollinger Bands.
The markets appear to be indicating a stair-step pattern higher that should carry us over the next 6 or 8 weeks until the indicator gets down to the 30 range.
Holiday Season Current Stock Holdings
It’s time to ring the register, and I have some positions on my books that I need to execute before the holiday.
In total, there are two positions that need to be adjusted, and three that need to be added.
I need to ring the register and get that cash in my account early for Black Friday shopping.
Current Trades
TTD
Profit-taking on TTD is a must-do right now.
Initial trade: Sold Jan 150/145 Put Spread down around the lower Bollinger Band and it has been performing well the past week.
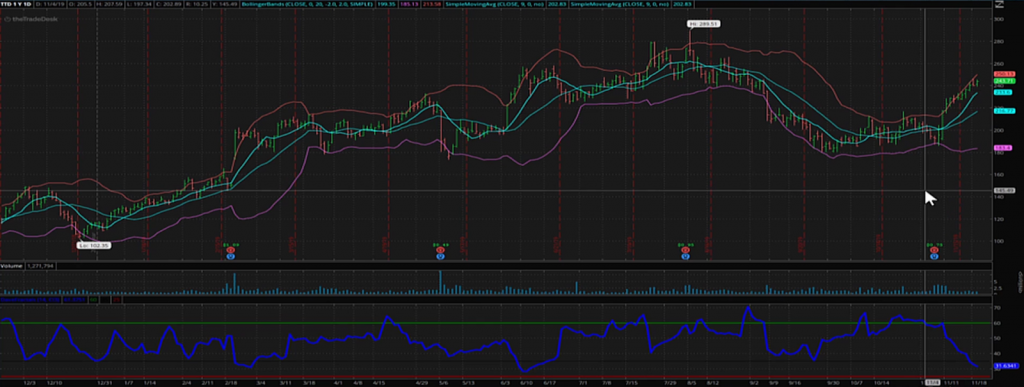
Next Trade: Going to buy back the Jan 150/145 Put Spread for $0.05 and lock in profits.
It’s time that we free up that cash so we can turn around and use it again for the next trade.
FNKO
Defense on FNKO is needed:
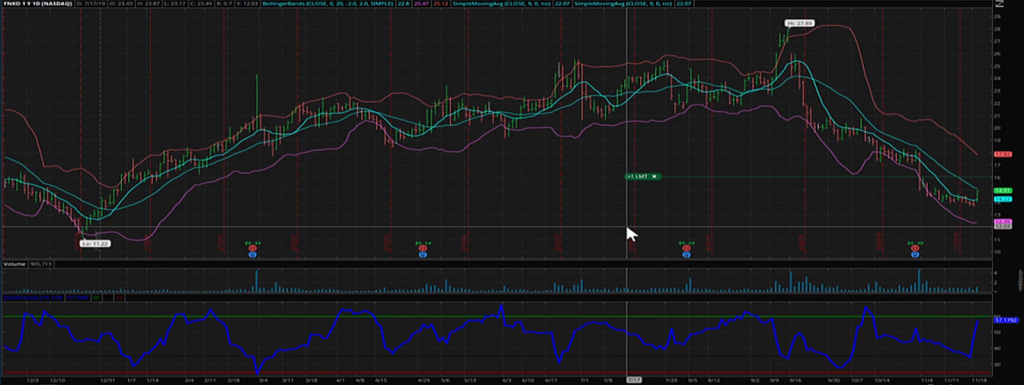
Initial Trade: Sold the May ’20 $12.5 put for $1.35.
FNKO ended the week at $14.91.
It is now time to get defense on.
Next Trade: Feb 2020 $10 put for $0.20 based on the 15% rule
New Trades
We are placing new trades on AMZN, HIIQ, and PAYS based on the daily charts.
AMZN
Amazon is primed for the holiday season going into the week before Thanksgiving and Cyber Monday.
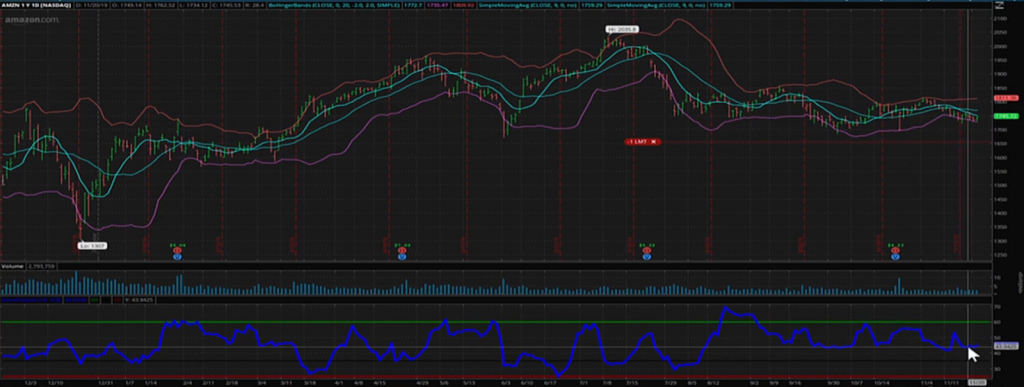
The weekly chart is looking great with the stock sitting right around the lower Bollinger Band.
The indicator is also nicely charged up showing us that the stock is ready for its next move higher.
Trade: Sell Jun 2020 1400/1380 Put Spread for $2.75.
HIIQ
Looking to take advantage of this downward move.
HIIQ has been in a steady decline and has made recent 52 week lows.
Looking for the stock to level off here at this support zone and get a little bounce in the price action.
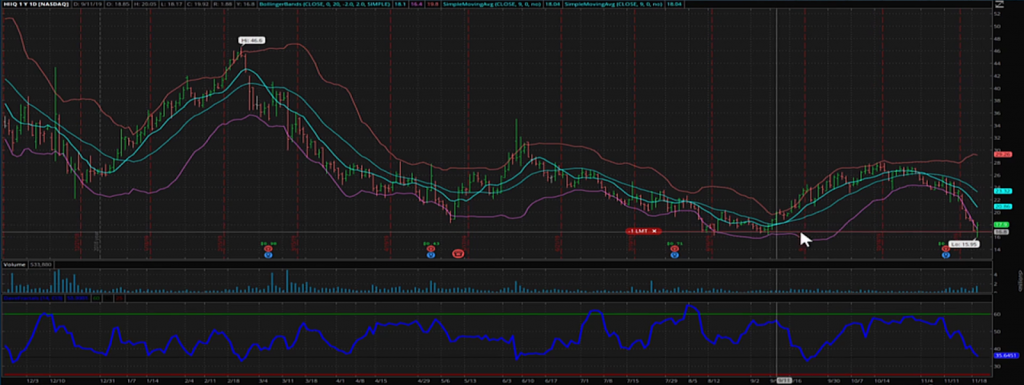
Trade: Sell May 2020 $8 Put $0.80 for a huge 10% return on risk!
PAYS
Level seems strong while the stock is sitting at technical support with the price and Bollinger Band to get the stock heading higher.
The put spread is a great way to trade this setup. Gives us some defensive options in case the stock heads lower since it’s still a bit above the 52 week lows.
One defense option if the trade goes bad is to get put the stock and sell calls against the shares to collect additional income.
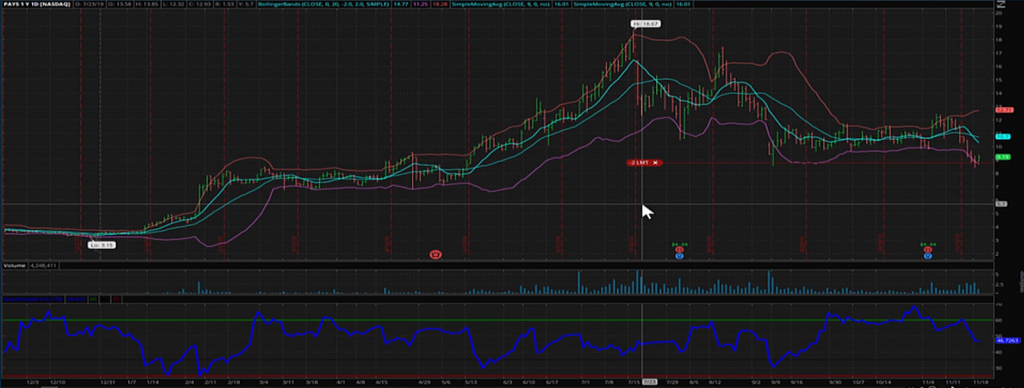
Trade: Jun 2020 $7.50/$5.00 Put for $0.85 which is approximately 30% return on risk!
That wraps up the trades for Thanksgiving week going into two major shopping days on Black Friday and Cyber Monday that kick off the holidays.
This could be the start of the uptrend going into December and into the New Year for a strong start to 2020.
To stay up to date with weekly summaries and trade alerts like these,

0 Comments