Many traders are getting chopped up and spit out.
It’s tough out there…
But you know what?
This is where we separate the rookies from the pros…
Now, before you get into deep water in these markets, there are three basic rules that you need to learn…
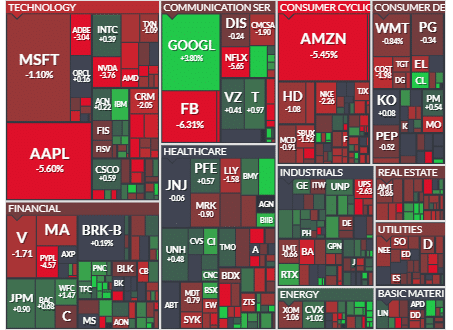
They are specific to these market conditions.
And in five minutes I’ll break it down for you.
P.S. Right now, I’ve got my eye on this one trade, in a stock which has sold off after earnings. Allow me to show you the strategy which I believe will get the job done.
How To Trade In Challenging Markets
It is an ugly earnings season…
And this stock was in for a doozy of an evening.
It all started the other night after the bell whenTWTR reported earnings…
Summary…it was not very impressive.
Here’s the stats to bore you…
Revenue: $936 million. Wall Street analysts had expected an average estimate of $777.15 million.
Earnings per share: $0.04. Analysts had expected $0.06.
Average monthly users: 187 million, falling short of the 195 million that analysts predicted, but up from the reported 145 million this time last year.
And the cherry on top?
Twitter’s earnings report also comes the day after Dorsey participated in a Senate hearing around the protections afforded the company by Section 230, a part of an internet law that prevents tech firms from being liable for content posted on their platforms. Section 230 revisions could lead to a major disruption in these companies’ businesses.
Sounds nasty, right?
It sure does!
You see, I had a feeling this was going to be ugly well before the street even had the earnings report!
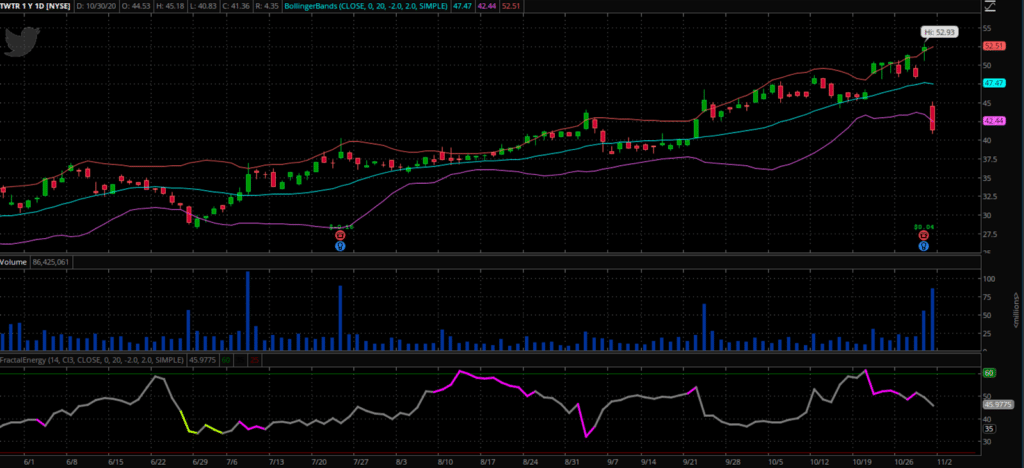
Here’s what The Bullpen members got from me two days before earnings were even announced!

I warned that TWTR was touching the upper Bollinger Bands and was exhausting itself as it climbed against the upper resistance levels.
What happened next?
The street didn’t like the earnings announcement and it left TWTR in a bad spot for traders and investors the next day.
But you see, I’m not a fortune teller or happen to know what is going on with the markets…
I have a set of indicators that I trust and have learned how stocks behave in certain setups after countless hours starting at their charts every day.
Now I want to show you some of my favorite setups and how to leverage them for your trading each day
Rule # 1 : Trust The Price Action
The first rule of trading is to trust the price action…
But what is price action?
Price action is the description of a security’s price movements. This movement is quite often analyzed with respect to price changes in the recent past, and typically combined with technical analysis.
In other terms, price action is a trading technique that allows a trader to read the market and make subjective trading decisions based on the recent and actual price movements, supplementing their technical analysis.
And since price action trading relates to past price movements, all technical analysis tools like charts, trend lines, price bands, high and low swings, technical levels (of support, resistance and consolidation), etc. are taken into account as per the trader’s strategy
What does this mean?
As a technical trader who relies on price action and technical indicators, I rely on a set of tools to help identify trading opportunities.
Rule #2 : Trust Your Tools
Like a mechanic, you’re only as good as the tools you have in your toolbox…
I mean, how good would a mechanic be if he didn’t even have the correct wrench to work on your car?
And as a trader, you need your own tools as well to trade the markets!
My three tools are Fractal Energy, Bollinger Bands, and price action of a stock.
Bollinger Bands
Bollinger Bands act like ropes in a boxing ring… the more you press up against them, the stronger you get pushed back into the center.
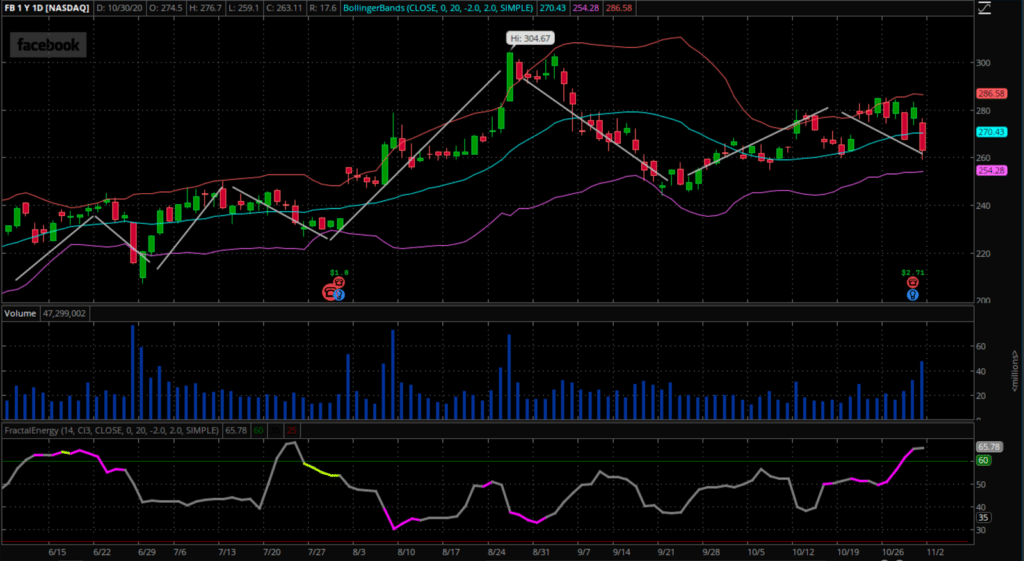
Here is an example of price action and how the Bollinger Bands keep pushing the price back into the “zone” of the indicator
Now, the other indicator I reference is Fractal Energy…
Fractal Energy
Fractals are the force that governs everything in life.
It’s a wondrous mathematical formula that explains how pinecones are formed and describes the characteristics of seemingly random coastlines/
And I found a way to integrate Fractal Energy into how stocks trade
Now maybe you have tools that you use on a daily basis and feel comfortable or you are in search of something new…
Either way, I believe Fractals can help improve your trading.
Here are two examples of Fractals on TSLA earlier this year…
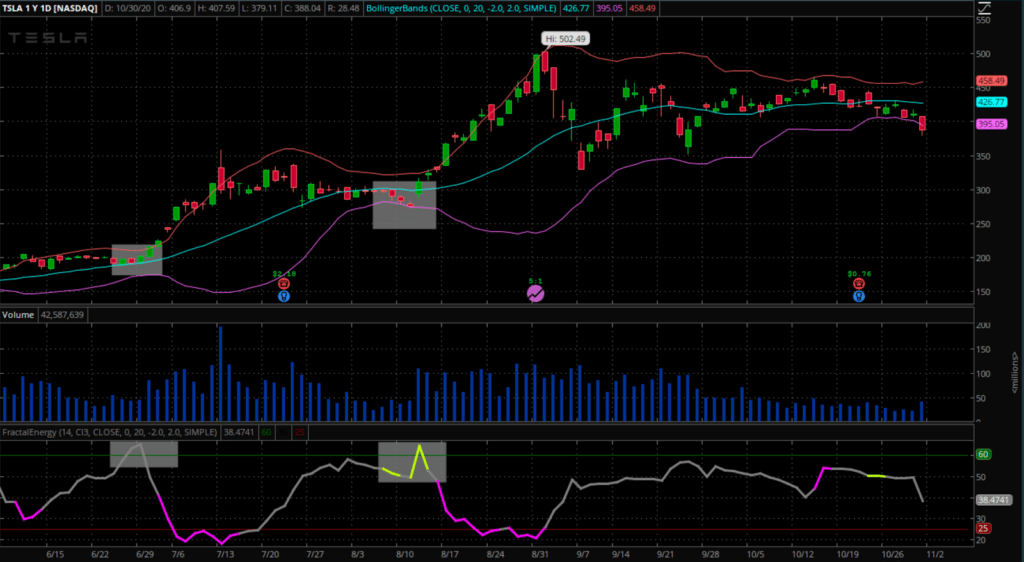
As you can see, each spike in Fractal Energy corresponds to huge movement in the underlying stock.
So no matter what the tools you use, make sure you trust them!
Rule #3 : Don’t Be The Gambler, Be The Casino
This might sound weird, but as a trader I am not a gambler
You see, I want to make sure that I only put my money to work into trades that I feel have a high expectancy of generating profits.
This means that I don’t want to be playing around with spending money on trading stocks, I want to collect money on every trade
And I do this by only trading credit strategies not debit strategies
In my opinion, this is the only safe way to trade and generate steady and consistent profits that fit my business needs and demands.
Now you don’t have to trade credit strategies around Fractals, but I think it’s the 1-2 punch for the TKO.
Five sample credit trading strategies include:
- Credit Put
- Cash Secured Put
- Covered Call
- Credit Call Spread
- Credit Put Spread
What’s On My Radar
You see, there are many stocks that are always on my radar… but I can’t trade them all when they pop up.
I need to pick the best of the best trades and put my money to work where I have a true edge
And one stock that I have on my radar is Facebook (FB) after their recent earnings
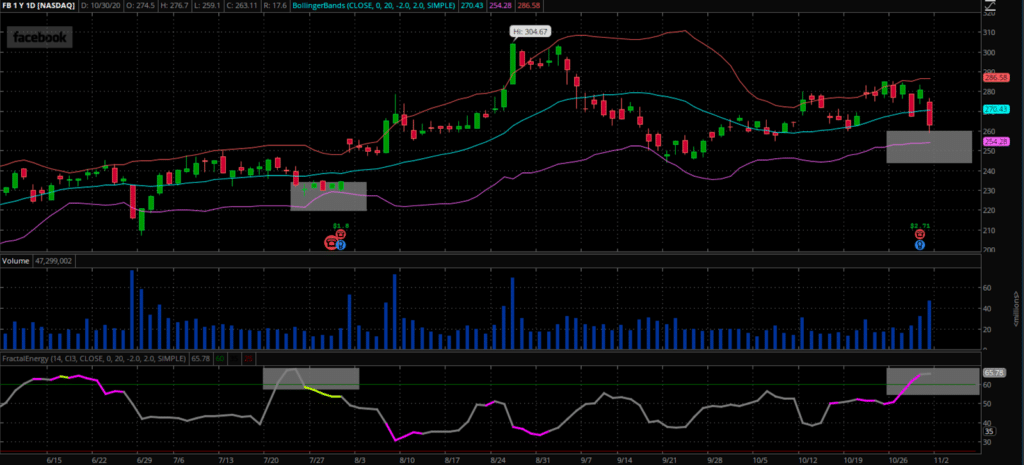
How would I trade this ?
Well, right now I don’t have a position in this stock but it’s on my radar for a potential trade.
I’m waiting for my perfect setup and it’s still missing a few key things before I jump into this trade for myself.
But I want to keep an eye on a few key levels,
- The lower Bollinger Band support level
- The recent pivot in September
- The price action around the last earnings announcement
These are the 3 things that I need to keep a close eye on going into this trade, and they are the final line in the sand for me.
If price can’t hold these levels, chances are I won’t be taking the trade and FB will just head
Lower.
But if Facebook’s price action can show stability and support is holding at these levels, and the rest of my trading tools signal a long trade, I will be looking to find a way to trade a credit spread.
Take Action Now!
Again, this doesn’t mean I’m in the position now or will be taking it anytime soon…
I still need a few key things to happen before this is a trade that I want to take for myself
But if I do take this trade, my Fractal Energy subscribers will be the first to find out!
And as a member, you will learn how I analyze every trade, find the exact options contract I want to trade, and the strategy I’ll be executing.
I will break down each trade so you can understand exactly what I’m doing to profit in these every week.
You’ll be surprised at how easily Fractal Energy, technical indicators, and price action can give trading opportunities far before anyone else spots these patterns.

0 Comments