It has been quite the month… markets have pulled back nearly 10% from their highs and now we are filled with growing uncertainty about what’s to come in the upcoming few months.
And this is all happening when it felt like the market was walking on eggshells as it was
But when will we get through it and move on to the next phase of the market?
So where are we going from here?
Well, it’s hard to know exactly but there is one indicator that I use that gives me a heads up to upcoming market movements
And as I have said in the past…
With market turmoil comes fantastic buying opportunities to own stock at a huge discount
Now… this one indicator is going to be the center of my attention in the next few days to give me the signal to get long the markets.
Bollinger Bands
Bollinger Bands were developed by John Bollinger as a price envelope designed to define the upper and lower price range levels of a stock.
For anyone who is unfamiliar with Bollinger Bands here is some background information to learn how this indicator can help you time the markets with superior accuracy.
Bollinger Band Indicator consists of a middle SMA along with an upper and lower offset band. And because the distance between the bands is based on statistics, such as a standard deviation, they adjust to volatility swings in the underlying price.
How do you read them?
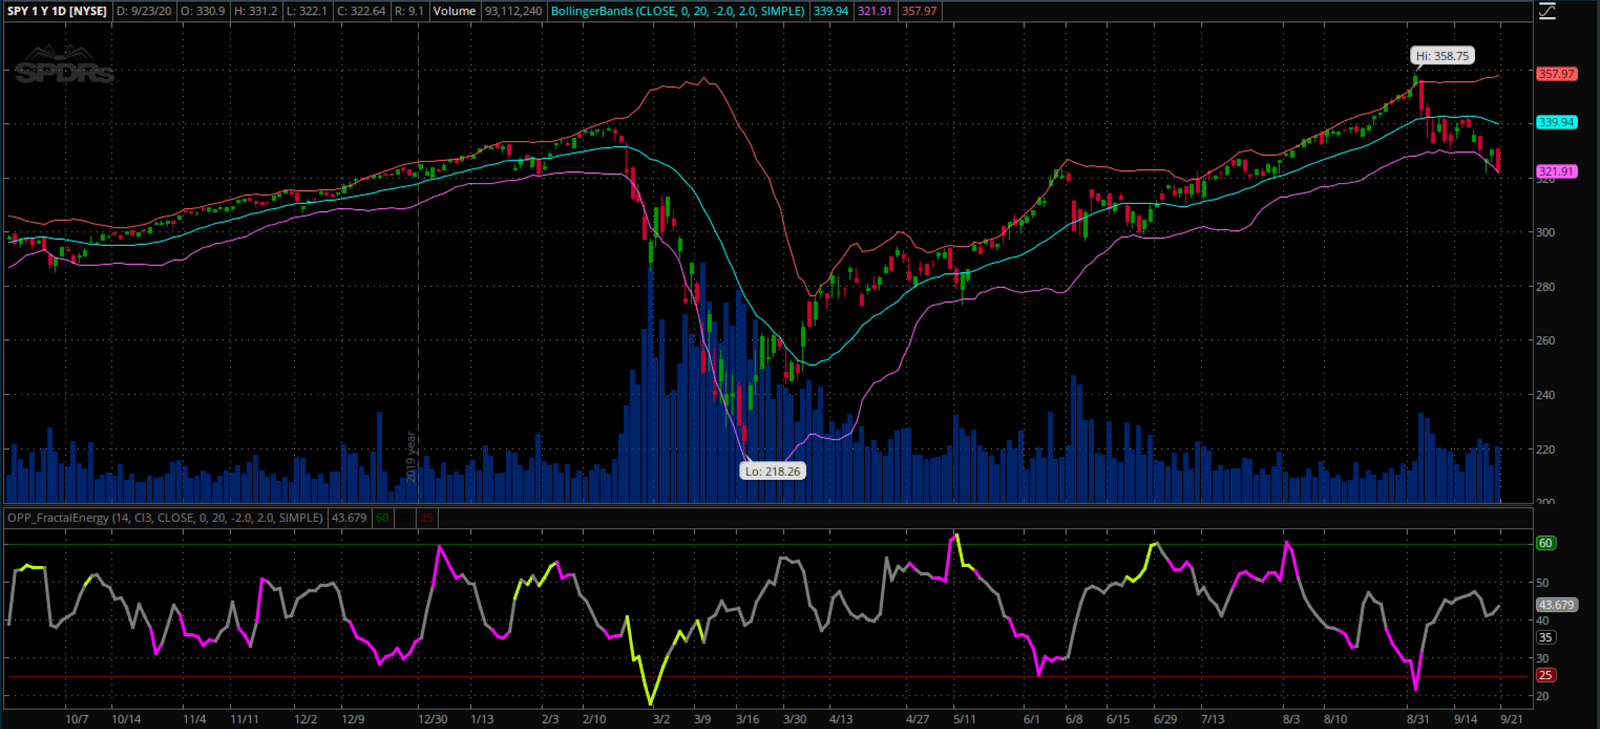
Bollinger Bands help to determine whether prices are high or low on a relative basis, and according to these calculations, price should fall within range 95% of the time!
Let’s take a look at an example chart.
Source: Thinkorswim
Now, how is the Bollinger Bands created?
The defining characteristic of the Bollinger Bands is the use of standard deviations to represent changing volatility, but what does that mean in practice?
The Bollinger Bands consist of three lines as follows:
The Middle (Basis) Bollinger Band – This is a simple moving average of price, usually set to a 20-day timeframe, although that is a variable that can be adjusted any time.
The Upper Bollinger Band – This line takes the 20-day simple moving average of the Middle Band, and then adds 2 standard deviations of that value.
The Lower Bollinger Band – This line takes the 20-day simple moving average of the Middle Band, and then subtracts 2 standard deviations of that value.
What does standard deviation mean?
The standard deviation value specifically changes the width of the bands, that is how far away the lower and upper Bollinger Band are from the middle band’s simple moving average.
In other words, the larger the value, the larger the width between the upper and lower Bollinger Band.
Now, this matters when trading… if the bands are too wide, the market may never move enough to touch the band in either direction, so while you can change it from the standard value of 2, be wary of going too far.
Then, having the standard deviation value too close to the average (less than 2) can lead to a lot of false signals as the market hits the bands repeatedly due to a smaller width.
So what is the importance of Bollinger Bands, anyways?
While all that covers how Bollinger bands are calculated, and how changing variables can alter how they interact with market prices, it is also important to understand what the lower and upper Bollinger Band represent.
The two bands move with the simple moving average of price, and the gap between the upper and lower Bollinger band widens or narrows as volatility grows or shrinks.
The Upper Bollinger Band represents the area in which price is nearing two standard deviations above the average and is commonly an area at which the price reaches resistance and tends to retreat to its simple moving average.
For the Lower Bollinger Band, it represents the area in which price is nearing two standard deviations below the average and is commonly a technical area where the market finds support level (unless there is a large fundamental change in the company in which these levels become irrelevant).
Therefore, with Bollinger Bands, we can identify reversals as well as trend breakouts very clearly, but how do we use that information in practice?
How Do We Trade The Bollinger Bands
Now that you know how these indicators work, as a trader, you need to know how to actually trade this information.
While some indicators and chart patterns only show a single trade set-up, Bollinger Bands are quite flexible. And when you combine the Bollinger Bands with other indicators, such as my proprietary Fractal Energy indicator, you can get signals that both work for trend continuations and reversals.
The Bollinger Band Reversal
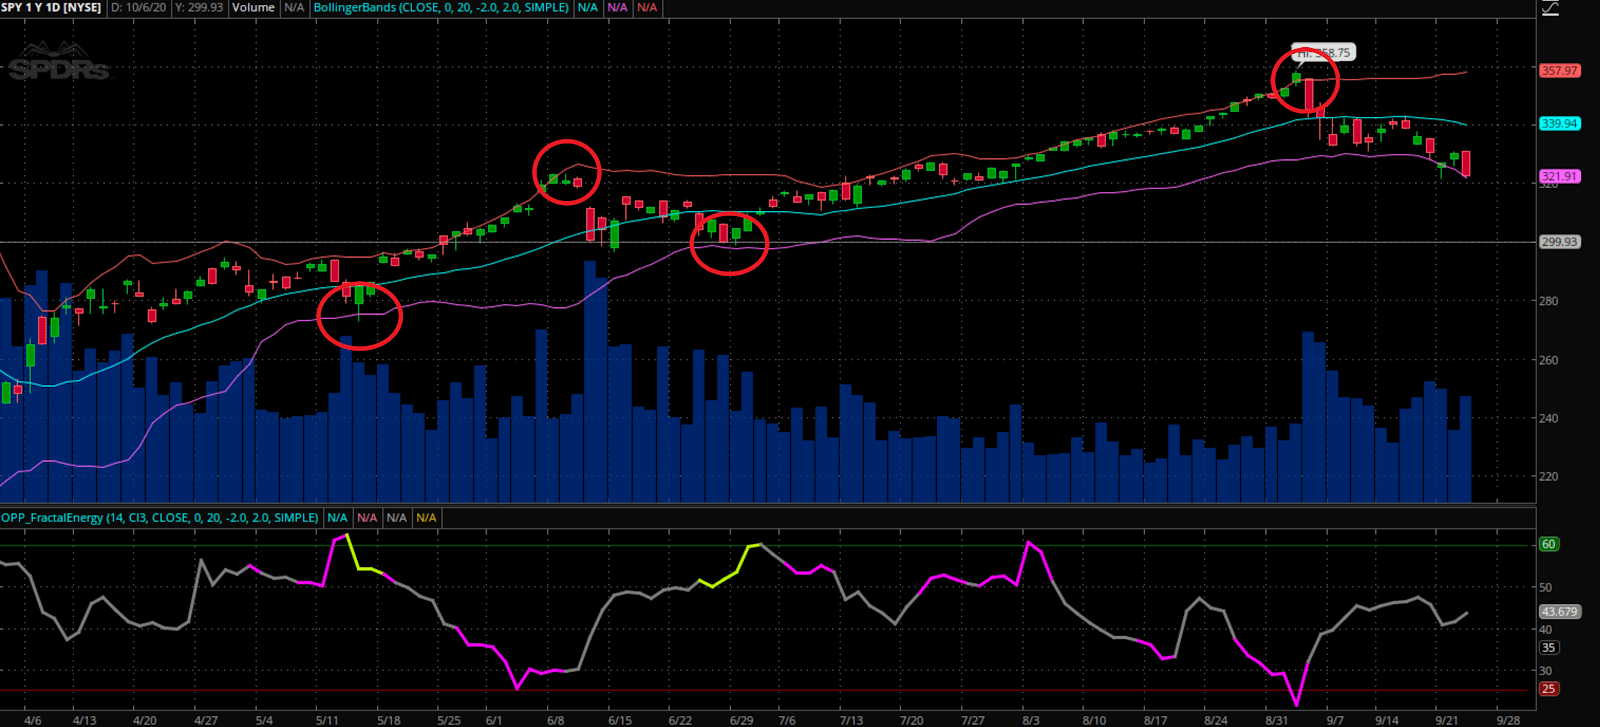
Because Bollinger bands set out to indicate the high and low range of a stock or other instrument, one of the most common ways to trade it is to wait until the market price reaches the lower Bollinger Band and look for a reversal to the simple moving average above (generally a candle reversal or lower indicator divergence).
Why is this important?
Well the reasoning behind it is simple; if the Lower Bollinger band indicates the support level, that is likely where technical traders will come back in for a quick scalp or complete trend reversal if on a daily time frame.
Source: Thinkorswim
As you can see, the Bollinger Bands act as the ropes in a boxing ring and keep the price trading inside of these price levels at all times.
But sometimes the bands actually act as momentum indicators instead of reversal indicators.
Bollinger Bands For Momentum Signals
The other trading strategy around Bollinger Bands is a momentum-based approach that uses the bands as trending instead of reversal signals.
This is a popular strategy for several reasons, but one of the main ones is that if a ticker has been trading inside a range for a while, when it does break out, the move can be very big and give traders a lot of profit.
The breakout trade works best in a market where the price has repeatedly hit the upper or lower Bollinger Band over an extended period without moving out of the range completely.
This is a signal for a larger move, and the idea behind the strategy is to buy the stock if the price breaks out beyond the upper Bollinger Band, which is the resistance level for the range.
Alternatively, you can short the stock if price breaks through the lower Bollinger Band, which is the support level.
As with the bounce strategy, the key to getting this right is confirming the market direction before getting into a trade, avoiding false signals.
Source: Thinkorswim
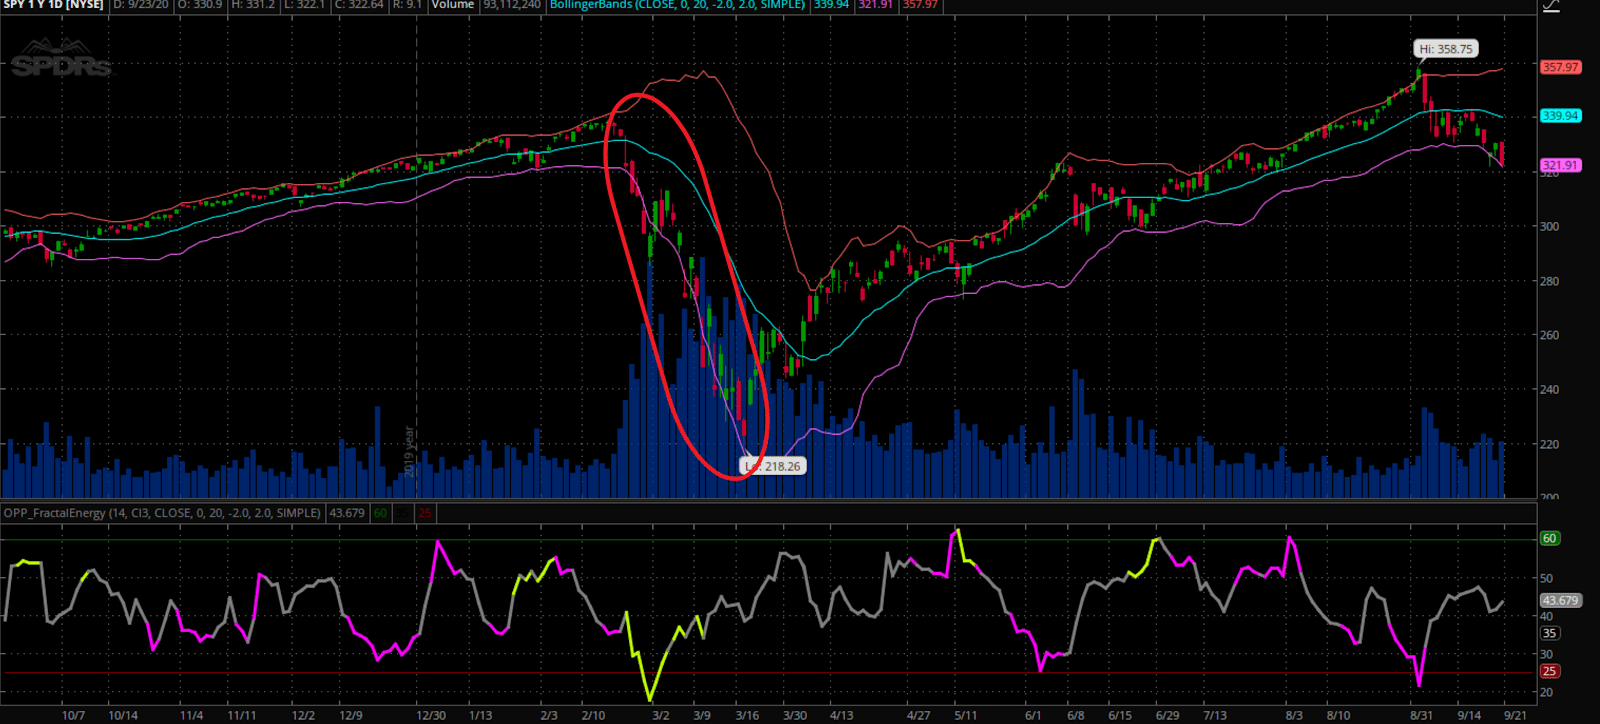
Highlighted in this area, you can quickly see how Bollinger Bands acted as a momentum signal instead of a reversal signal.
In this example, you would actually want to trade this signal in the direction of the momentum instead of trying to go with a reversal trade.
Recap Of The Bollinger Bands
To summarize the points about the Bollinger Bands
- When Bollinger Bands tighten, there is a high likelihood that price will have a sharp move
- When the bands separate by an unusually large amount, this is showing a significant increase in volatility or a gap in stock price.
- Price can exceed and even hug or ride a band’s prices for extended periods of time.
- Price has the tendency to bounce within the bands’ envelope, touching one band and moving back towards the other.
- You can use the middle SMA or opposite band as target prices and exits for your trading
- If prices move outside of the band, it’s expected to see a trend continuation until the price moves back inside the band.
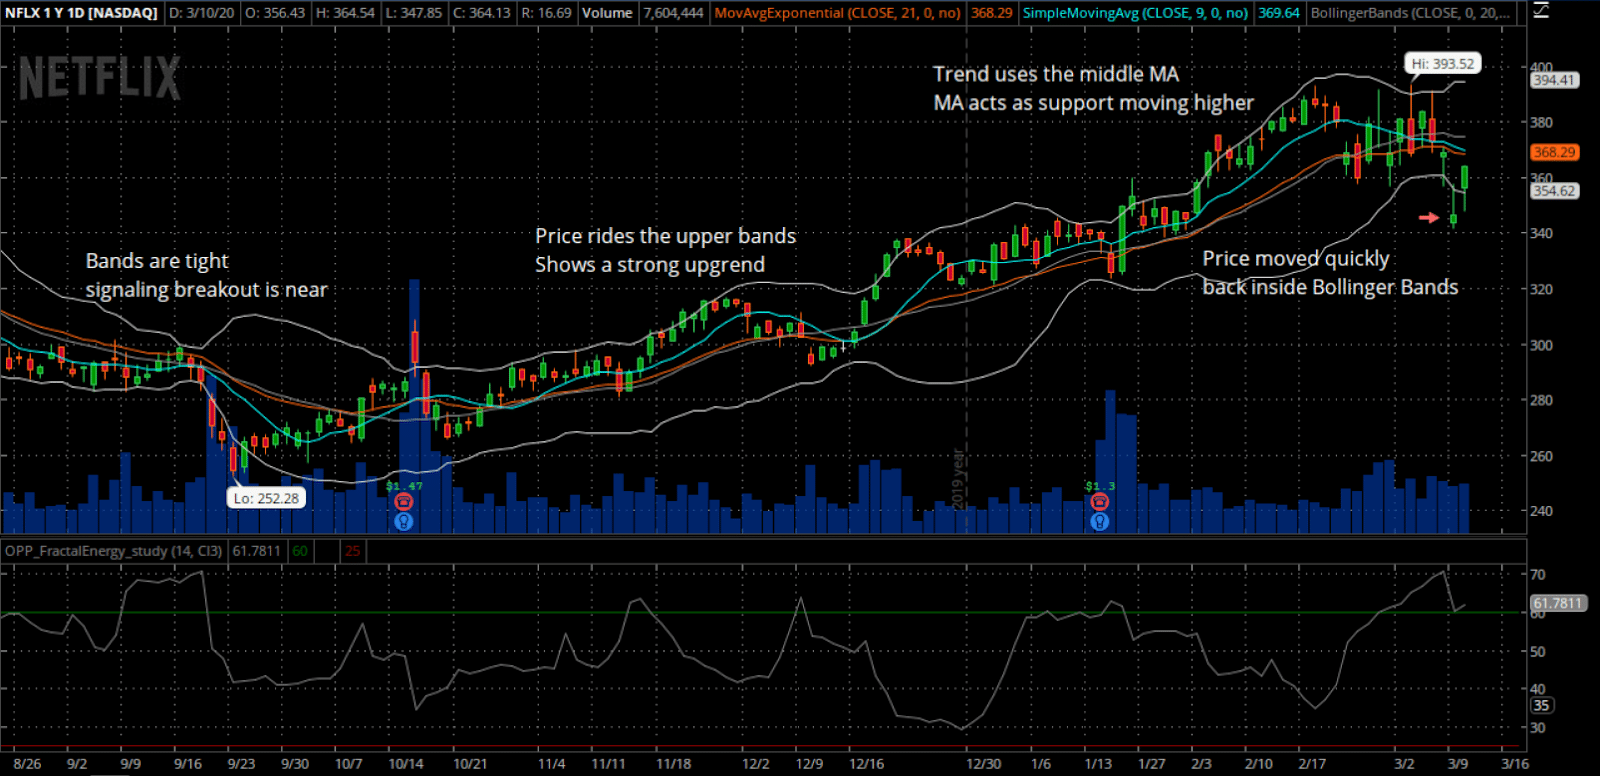
Let’s take a look at this chart closer…
Source: Thinkorswim
Here you can easily see exactly the many signals the Bollinger Band will give a trader from the items that were listed above.
In a quick glance the trader will see :
- Tightening of bands leads to breakout
- Stock trends higher, riding upper band
- Trader can buy the moving average the entire way up
- Price drops suddenly below lower band and snaps back inside the next day acting as a price barrier
So how does this work for trading?
It’s quite simple to apply this logic towards a trading strategy, like a Credit Put Spread system.
Credit Spreads Stock The Odds In Our Favor
Option sellers take maximum advantage of the option time decay theory, commonly known as Theta Decay.
OTM options lose value quickly and become worthless at expiration.
Now what do one of these strategies look like?
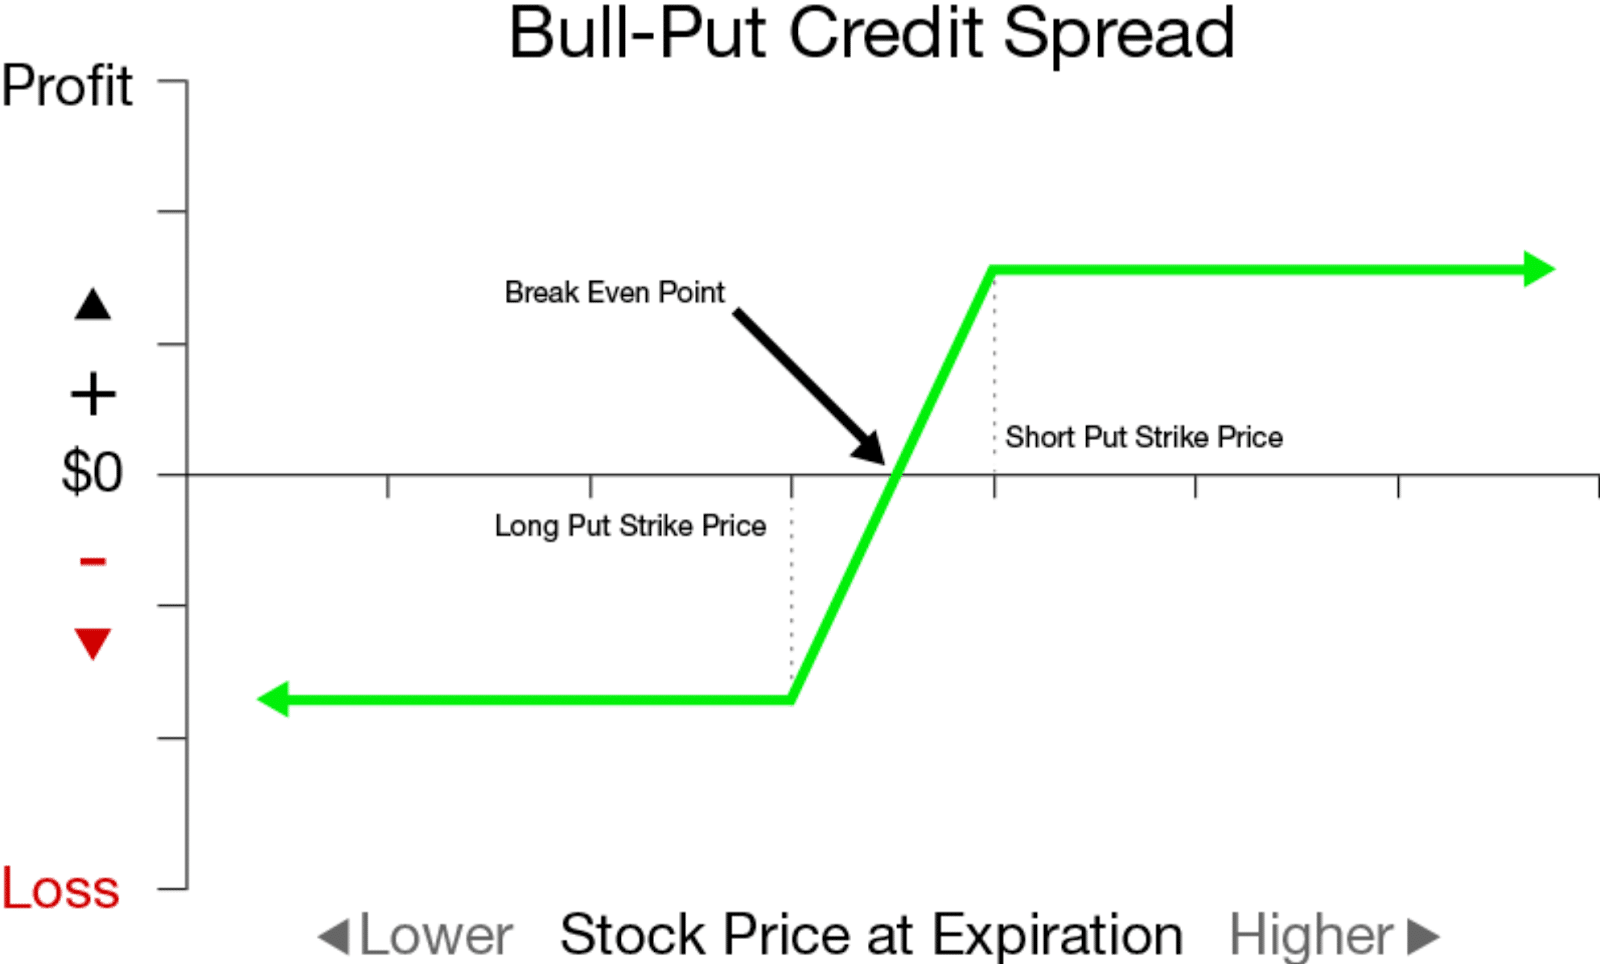
I know this might look scary, but it’s a lot more simple that you might think.
In order to create this strategy, you would want to sell a higher valued put, and buy the lower valued put as protection.
What does this give you?
It allows you to collect a net credit on the trade, which is the difference between the two puts.
But why do I like this trade?
Well, when you properly select your strikes, you can generate odds of winning that mimic the likes of a casino.
Plus when you generate income from collecting premium, you can steadily return close to 100% returns each and every trade.
Remember traders, there are many ways to make money in this market and selling options is one of my absolute favorite go-to strategies.
Key Points:
- Credit Spreads can profit if the stock goes down, stays the same, or goes up depending on a Call or Put Spread
- Limited risk compared to Naked Puts and Naked Calls
- Puts the house odds in your favor compared to buying Options or Stocks
- Allows you to get paid to take risk unlike stocks
And you see, when it comes to placing a trade, you need these 4 things
- To have the stock selected
- A price range identified
- An indicator to show you strength of the stock
- And an options strategy to tie it all together.
Fractals, Bollinger Bands, and Credit Spreads are the cornerstone of Options Profit Planner
Putting it all together
I know this market is crazy… and even overwhelming to many. But you have to trust the tools that everyone uses to trade safely.
And two of those tools are the Bollinger Bands, Fractal Energy, and Credit Spreads. And when they are combined, they really are one of the best strategies a trader can deploy in markets that are unpredictable.
When looking at these strategies combined, this really is where statistics and probability really shine and make for a highly profitable trading opportunity.
Not only do I trade using an indicator that tells me 95% of the time price will stay inside a range, I also combine it with an options strategy that can pay me 100% ROI on my trade if timed correctly to the markets.
So… to recap what makes this trade a really high probability winner.
- The Options sellers always have statistical advantages over buyers. That’s a built-in feature for the entire options market, regardless of calls or puts.
- Trading credit spreads can pay me 100% returns, which cannot be done when buying calls or even the stock outright.
- Lastly, combining a proven indicator into my trading system that when signals a stock is oversold both statistically and on the charts. Remember, there is a 95% chance it will head higher and not lower.
Click here to learn how I use the Bollinger Bands weekly to determine the market direction

0 Comments