Some want you to believe that trading is an easy and stress-free occupation.
You’ve seen the commercials… A man rolls out of bed 10 minutes before the day starts and never gets out of sweatpants.
The reality looks more like this for full-time professional traders:
- 5:00 am: Wake up
- 5:15 am: Run 5 miles
- 6:00 am: Breakfast
- 6:30 am: Review the pre-market
- 8:30 am: Prepare trades for the day
- 12:00 pm: Lunch
- 3:45 pm: Prepare for the close
- 4:00 pm: Monitor earnings (if any)
It takes dedication and commitment to get to the top of the mountain… and trading is no different!
But what if I told you that you can cut out hours a day from that routine?
That’s okay if you don’t believe me.
Just give me a few minutes and I’ll explain to you how it’s possible.
It starts with taking shortcuts.
The shortcut I’ll be sharing with you today is all about filtering.
A process of narrowing down the thousands of tradable stocks, to just a small few.
Filtering the Market Using Technical Analysis
Every trader faces the challenges of identifying potential trading opportunities and picking the right stock to put their money into.
With thousands of candidates to choose from, researching each and every stock chart can be overwhelming and time-consuming.
In order to save time and narrow down the universe of stocks into a manageable group to choose from, traders turn to technical analysis tools as a filter.
Technical Analysis Tools
Many traders think it’s best to load up charts with as many indicators, drawings, and trend lines as they possibly can.
Almost as a magical signal will appear and show them the way forward.
This is not the way, and less is definitely more when it comes to technical analysis.
Let’s take a look at 4 of the most popular tools used by almost every trader.
1. Support and Resistance
If a stock is moving up and down between consistent lows and highs, it is said to be “range-bound.”
Drawing horizontal lines at these price levels will show a trader where buying and selling zones are located.
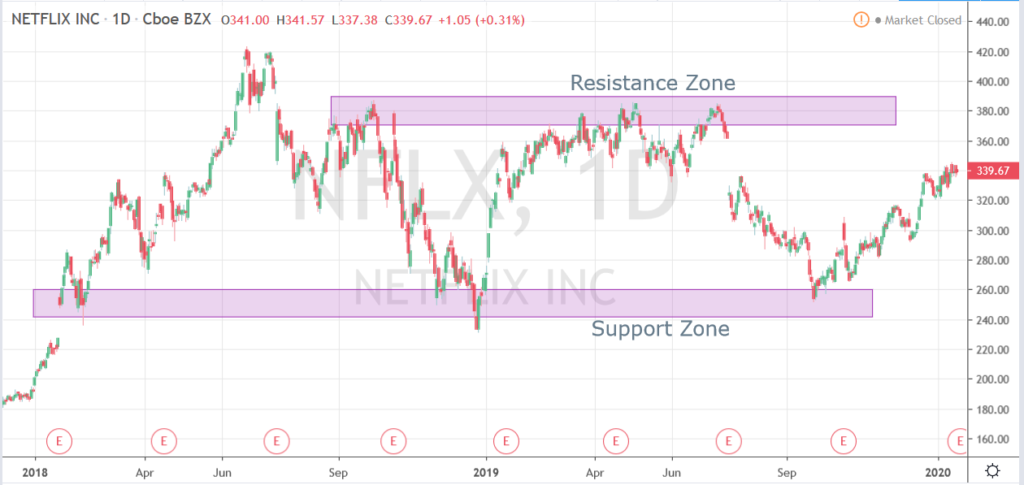
Source: www.TradingView.com
You can use these price levels to identify where support and resistance levels are to place trades or stop orders.
This will help to clear up any confusion in regards to trend directions, breakouts, breakdowns, and range bound markets.
2. Trend Lines
A simple trend line can go a long way.
There should not be more than a handful of trend lines on your chart at any time or it will make it difficult to determine any meaningful market information.
A trend line can help a trader assess whether a stock has been bullish, bearish, or flat. In order to determine a bullish trend, draw a line connecting the pivot lows over a designated period.
A stock price that is experiencing higher lows can indicate a bullish trend, and a stock that is experiencing lower highs can indicate a bearish trend.
If you draw one or both of these lines you can create a trend channel to help evaluate both the strength and duration of a market trend.
Here is an example stock in an uptrend.
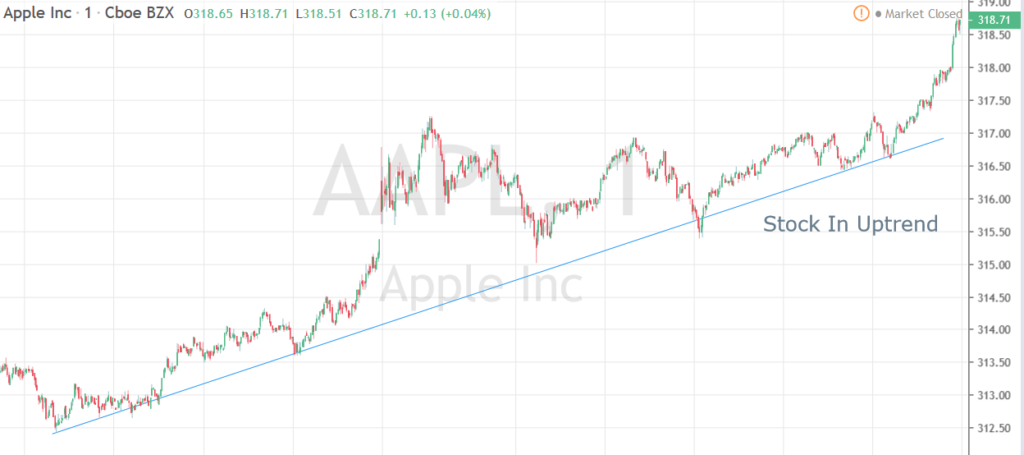
Source: www.TradingView.com
Here is an example stock in a downtrend
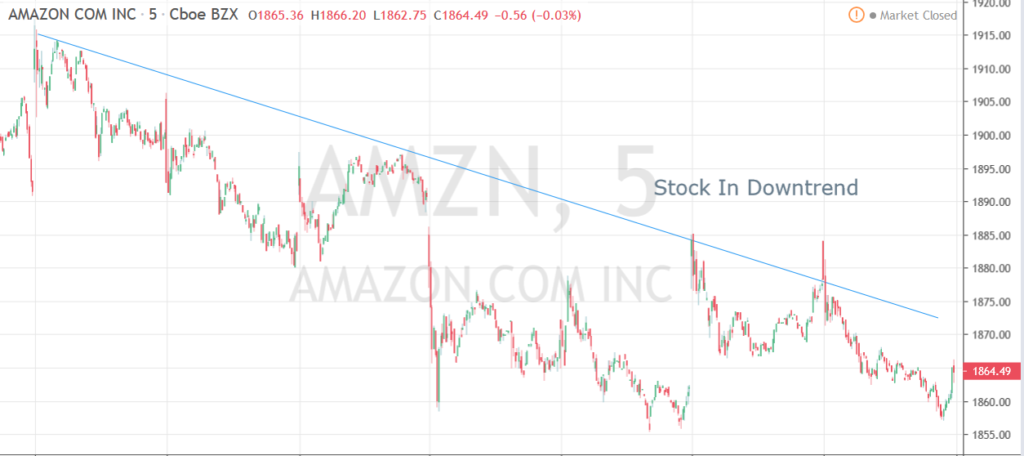
Source: www.TradingView.com
3. Moving Averages
Moving averages reflect the recent price history of a stock over a designated period. A simple moving average is the sum of the prices over a period divided by that time period.
Moving averages show you how the current price compares to an average price over a stock’s history. A stock with a current price above its moving average is said to be better performing than its average.
Some typical moving average timeframes are 20,50 and 200, which are 4,10, and 40 weeks, respectively.
There are additional ways to leverage the power of the moving average and that is with watching for a “crossover”, or when one moving average crosses over the other.
When a moving average with a shorter time frame crosses over (and above) a moving average with a longer time frame, this is considered a bullish indicator. In reverse, if a shorter time frame crosses over (and below) a moving average with a shorter time frame, this is considered a bearish indicator.
Here is an example of a Bullish Crossover on Facebook.
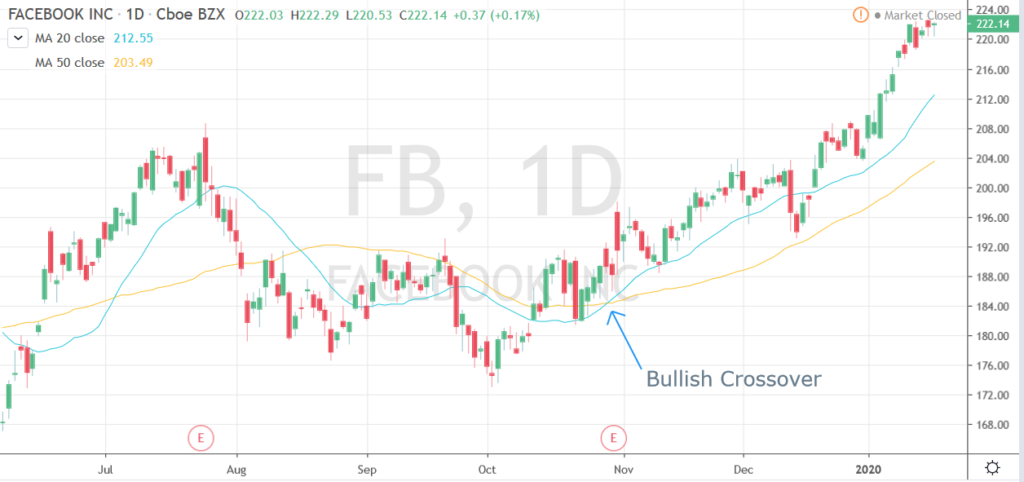
Source: www.TradingView.com
Here is an example of a Bearish Crossover on Facebook.
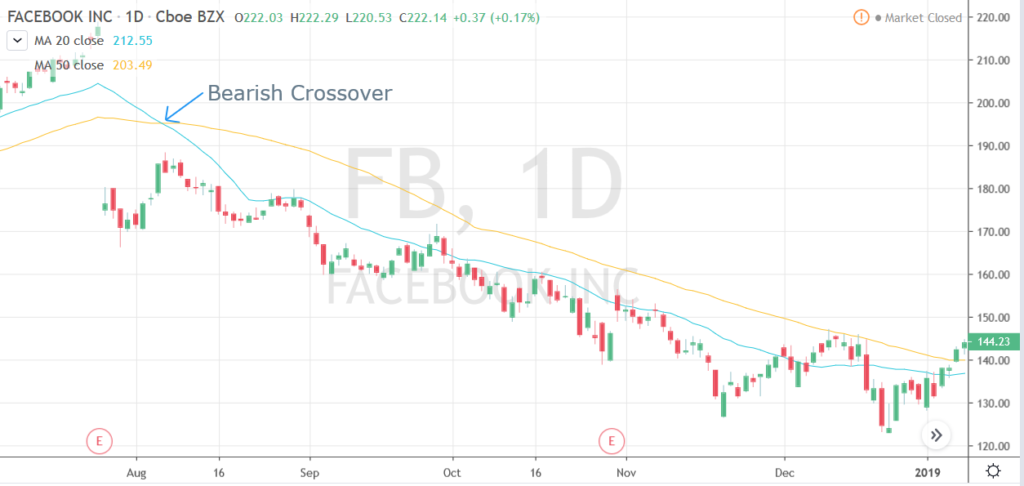
Source: www.TradingView.com
4. Volume
Looking at volume in combination with price activity can indicate how strongly buyers or sellers feel about the stock’s price. The larger the volume indicates greater conviction of that price action in the markets. When volume exceeds its moving average, the support for the price action is favorable and less likely to be a “fake out” in price.
Filtering the Market
When you are assessing the markets, a top-down approach can be extremely helpful.
You would want to begin by using major indexes like the SP500, Dow Jones, or NASDAQ and observe what the market is actually doing.
For example, if you are a technology stock trader only, looking at the Dow Jones or SP500 might not be an appropriate market to watch. Depending on the stocks you watch, it’s best to monitor the corresponding market ETF for the most accurate view.
Technical analysts believe that what the market is actually doing is more important than why it might be doing.
Here are some examples of a market filter.
- Is the overall market trending up or down?
- How do the stocks align to the index it’s made up of?
- Are the markets near support or resistance?
- Does volume support the current price trend?
Filtering Sectors
Once the “big picture” is understood, it’s time to determine which sectors within the markets are driving any trends.
If the overall market is bullish, some sectors are likely to also be bullish, but some could also be bearish.
Likewise, if the overall market is bearish, some sectors are likely to also be bearish, but some could also be bullish.
If you are a trend trader, you would ideally want to identify the two or three sectors leading the trend.
In choosing two or three sectors, you have successfully narrowed down the stocklist into a small percentage of the market without having to focus on indicators or specific stocks.
Remember, the objective of filtering is to find the opportunity that fits your specific criteria as efficiently as possible… without looking at every chart in the market.
Filtering Stocks
Now, this is where the search gets more specific.
Just as you looked for sectors that were leading the market trend, you now want to look for the stocks that are leading the sectors. This process is designed to help you identify the strongest stock or the weakest stocks.
Once you have created a watchlist, you can filter it down even further in a few different ways.
Some ways to filter down stocks even further are:
- Filter stocks with prices above their moving average
- Uptrend breakouts
- Downtrend breakouts
- Patterns with increasing volumes
- Prices near support or resistance
And the list continues, and each trader has their own unique stock filter based on their trading strategy.
The idea is that once you have reduced your stocks to a manageable number, scan each chart manually and begin to choose the stocks that present the best opportunity that best fit your trading style and objective.
Summary
With a few steps and basic filters, you can effectively reduce thousands of stocks to a smaller qualified list that meets your specific criteria.
The goal?
To pick the stocks that align with your market outlook so you can make a more objective decision about what and when to trade.
There are also some various free tools that are available for you to use on the web. One of my personal favorites is www.finviz.com which I use to screen for my perfect trade.
I use filters before each and every trade to assist with narrowing down stocks to fit my perfect option selling strategy and increase the chance of a successful trade.
Want to learn more about how I apply a screener to my trading and had a 100% success on every trade in 6 months and counting?
Click here to join Options Profit Planner today!
0 Comments