Negative oil prices could soon become the new normal.
Rumors are circulating that the Chicago Mercantile Exchange will dissolve the US Oil Fund (USO) if front month oil futures turn negative before it rolls into the next contract.
So if you’re thinking that buying USO here is a buy then think again.
The entire industry is reeling from the reality of now negative prices… once a theoretical quirk, which has now become reality.
Who’s going to survive this chaos? It’s too hard to tell just yet.
Unfortunately, everything will get far worse before it gets better in the oil sector.
And there is little that the U.S. government can do to fight off steep production losses and bankruptcies that are soon to pile up.
So… how did we even get here?
Well, it started as a geopolitical heavyweight fight between the two largest producers in the world…And the bigger they are, the harder they fall.
It was that perfect storm, that proverbial Black Swan – spoken about my many, and seen by few… until now.
But, I noticed an anomaly in my Fractal Energy Indicator that set off alarms back in January to a problem in the oil markets!
This frightening signal alerted me to trouble ahead and now it’s signaling the possibility for a bottom in the oil markets and a generational wealth building opportunity.
As The Dust Settles
How did this even happen?
During intraday trading the June contracts fell by nearly 50% demonstrating that the ruinous supply gut is not going away anytime soon. Then simultaneously, the May contracts imploded and left a crater in the oil markets as the front-month contracts traded negative 400%, to -$40 on the day.
While many analysts forecasts suggest that production can begin slowing as wells shut in, this may be too little too late, as the amount of reduced production wont take effect until the end of 2021.
Most of this is contributed to the lack of Russia having the ability to shut in their wells. If they tried to do so, drilling companies face the risk of severe, if not permanent damage to their drilling sites. Without the ability to let off the gas, this drilling will result in production staying pinned at its maximum output.
Now it’s to the point of no return, and the only solution to this disaster in the oil and gas industry is to resort to a government bailout plan.
Here’s what traders were facing in the oil markets as the futures were closing for the day.
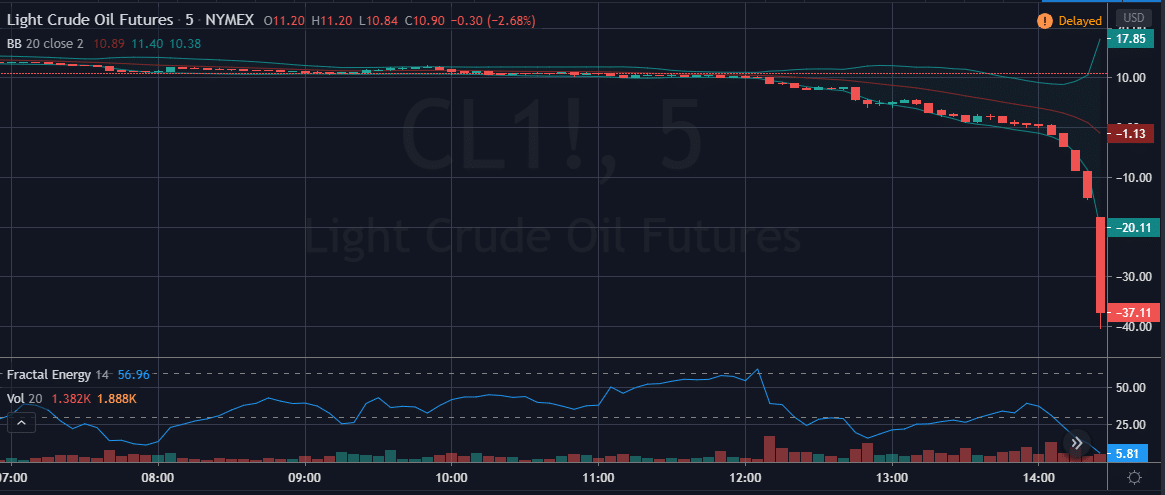
Source: Tradingview
Straight carnage!
Not many firms are going to survive this type of market collapse that rely on oil prices to stay above $30/barrel to make a profit, let alone -$40/barrel.
And being caught on the wrong side of this trade will ruin anyone’s day.
But using the Fractal Energy Indicator you might have not only stayed out of the wrong side of the trade, you might have captured this entire move as oil moved lower!
Fractal Energy – The Chart Pattern
As a trader, spending hours going through stock charts and looking for patterns is just part of the day in the life of a professional trader.
To cut down the work that I have to do every day, I focus on stocks that meet qualifications set by the Fractal Energy Indicator.
When looking to understand what price action is doing you need to reference information other than a basic stock chart to get a true edge in the markets.
And by having an indicator such as the Fractal Energy indicator you can determine stocks that are charged to run or exhausted and ready to stall out.
But first – What are fractals?
The power of fractals allows me to determine the strength of trends and how much “life” is remaining in a stock’s movement.
There are 2 main components of Fractal Energy:
- Markets Fractal Pattern
- The Internal Energy
By combining those two different components you create a single indicator that is able to successfully determine the strength or weakness of a trend on any stock.
Let’s see what I mean by looking at the chart of AAPL and how it picked the top of the market.
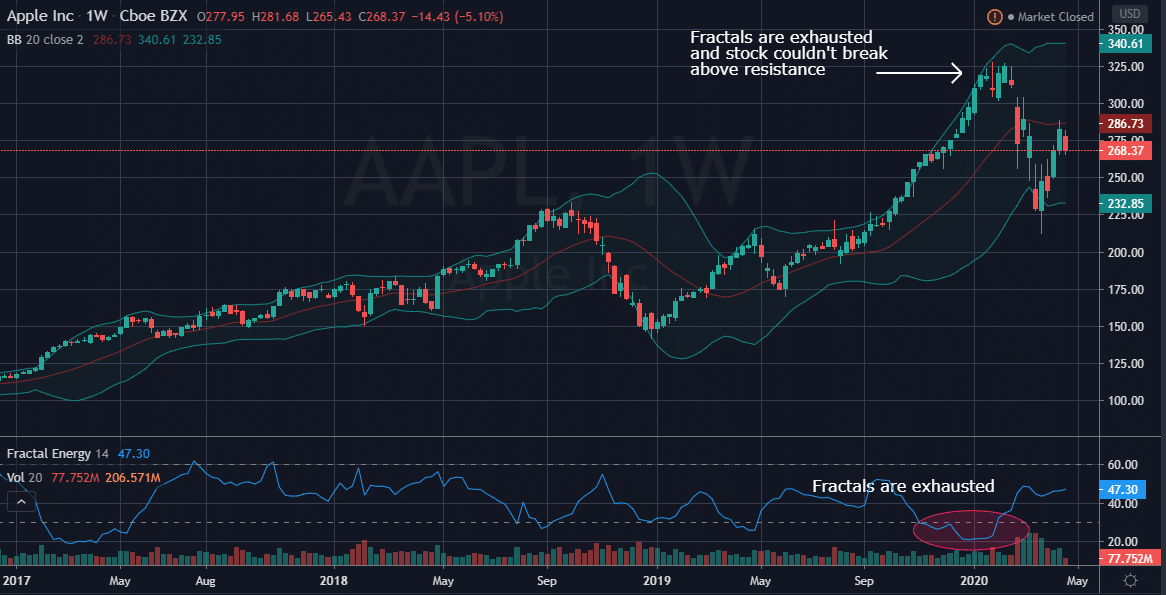
Source: Tradingview
In Apple AAPL you can see that the Fractal Energy Indicator was signaling exhausted energy to AAPL forming at the beginning of 2020. And then shortly afterwards, the stock plunged lower towards the lower Bollinger Bands.
In this chart you can see two key factors as how the trade unfolded:
- Price couldn’t break above the resistance level at $325
- The Fractal Energy Indicator was severely exhausted
From the technical analysis viewpoint, the failed breakout was a large bearish signal for AAPL. Then combined with the internal energy, or Fractal Energy showing that it was weak, it was the perfect setup for AAPL to sell off.
And that’s exactly what happened.
Instead of an exhaustion collapse, let’s take a look at how momentum with a fully charged fractal energy.
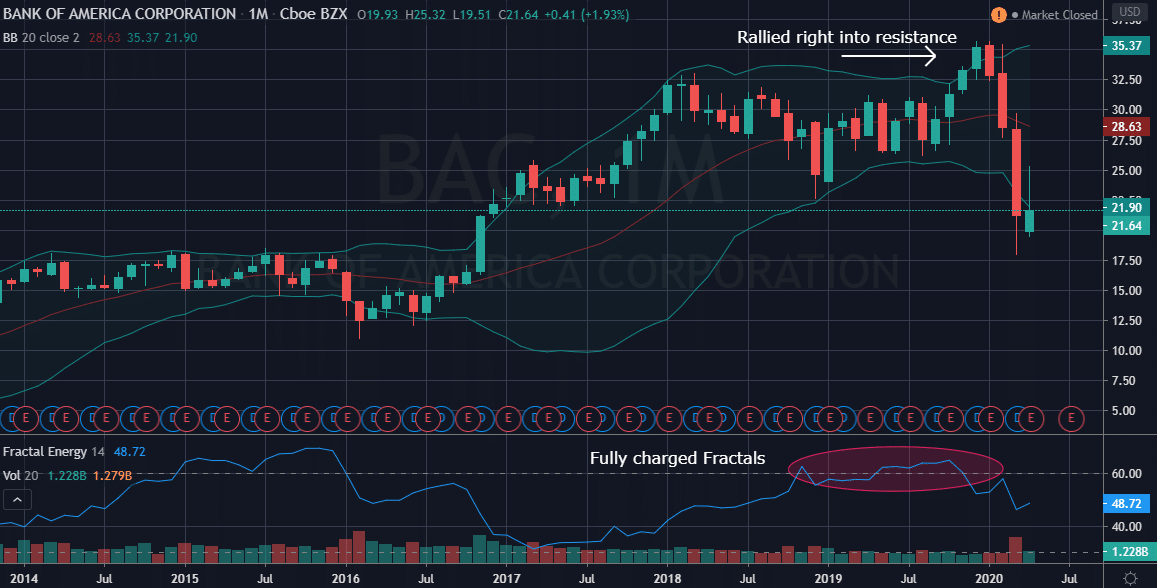
Source: Tradingview
And on BAC you can see that the stock rallied right into the upper Bollinger Band levels which is known to be an area of resistance for a stock.
That reversal against the Bollinger Bands combined with the charged Fractal Energy actually caused the stock to reverse and release its energy to the downside!
Since a high reading on the Fractal Energy means the internal energy of a stock is fully charged, the stock is then ready to run higher or lower.
The fractal energy is just an indicator of being charged or exhausted, and it’s important to remember that it does not necessarily pick the direction of the trade.
So…now that we covered how Fractal Energy is successful at finding market topping patterns, let’s see what it showed us for crude oil before the historic selloff occurred.
Oil Stocks
Now lets see how we could apply this trading strategy to the oil ETFs and even the futures markets to find great setups to trade.
Let’s take a look at how this played out for USO.
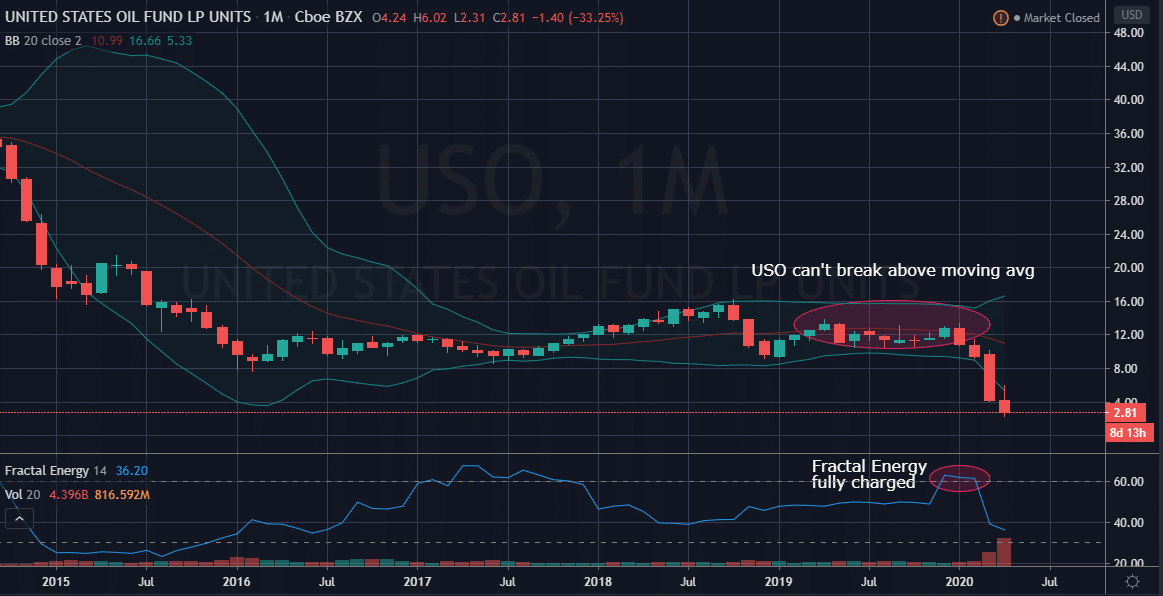
Source: Tradingview
What happened?
3 key points to look at :
- The price couldn’t trade above the middle moving average of the Bollinger Band
- The overall trend of the USO ETF was pointing negative
- Fractals were becoming charged
And it was a similar story for the Crude Oil Futures.
USO was in a situation where it couldn’t form a bullish pattern and ended up breaking down for having a charged Fractal Energy in a bearish pattern.
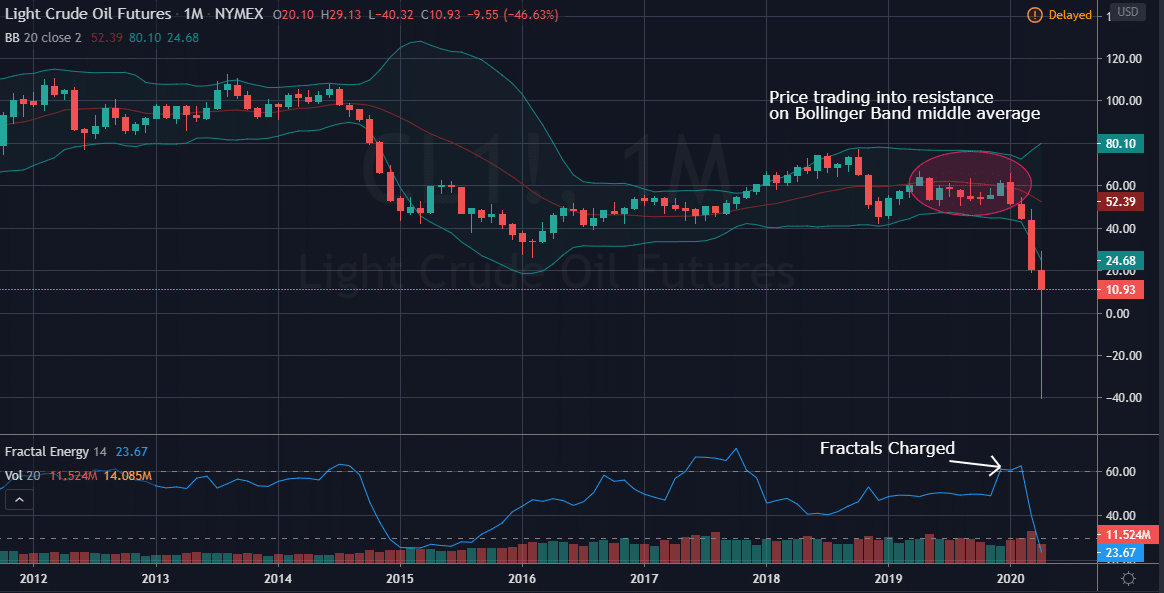
Source: Tradingview
In the monthly oil futures, we can see a few things occurring.
3 key points to look at :
- The price couldn’t trade above the middle moving average of the Bollinger Band
- The overall trend of the crude oil futures was pointing negative
- Fractals were becoming charged
This is an example of an extremely bearish pattern that was forming, and once the Fractal Energy was charted, it allowed the futures to break down in the direction it was ready to move in.
And mixing Fractal Energy with a bad economic environment and supply and demand issues just led to the perfect storm for this type of collapse.
So what’s next?
Well, we don’t know – but it seems that the fractals are now exhausted at these levels.
From a technical point of view, the futures will need to settle in and let the fractal energy to recharge before it’s able to make any significant move up or down from here.
Wrapping up
Fractals are the cornerstone of Options Profit Planner and when it comes to placing a trade I always make sure there’s an edge by leveraging the power of the internal energy of a stock and pattern.
And this couldn’t be more clear than when looking at what happened in the oil futures the other day when they topped over 400% by the end of the trading day.
For Options Profit Planner, I make sure that I utilize a strategy of selling options or spreads to focus on generating a steady flow of income for my trading business.
Credit spreads give unique advantages to traders over debit spreads, with the most important being that you are paid upfront to place a trade!
And as a business owner, I want to make sure I know how much money I have coming in and out each and every month.
Since running a trading account is actually a business and not a trip to the casino!
To learn the process I use day in and day out to lock in consistent profits, click here to sign up today!
0 Comments