This market has one thing on its mind, and that’s to cause pain to anyone trying to get long.
It’s just a matter of time before it reverses, but trying to time it accurately is always the problem!
And it’s often referred to as catching a falling knife that leaves people with some big cuts to their trading accounts.
In markets like these, there are many opportunities for traders to capitalize on fear and it comes down to two things… patience and discipline.
To calm nerves and make execution seamless a trader must have a trading system or custom indicator to handle the way stocks are selected and traded.
And it doesn’t matter if the markets are heading up, down or sideways… when trading options there is an indicator to help you make money!
I turn to my custom indicator that taps into the inner markets and Fractal Energy of the stocks.
And this indicator has nailed the market top and bottom to almost the exact day of the reversal!
Today I’m going to explain to you how it works.
Fractal Energy
The Fractal Energy Indicator is the cornerstone of Option Profit Planner and is used to identify turning points in the markets.
This indicator is designed to measure the strength of trends and how much “life” is left in the stock’s movement.
Fractals Energy Indicator is broken down into two main components and is able to determine the energy of a trend and if it’s in complete exhaustion.
So how does it work?
Analyzing The Markets Using Fractals
By using the Fractal Energy Indicator on the Weekly and Daily timeframes, we can break down current trends and predict market movements coming up.
Here’s a look at the SPY’s on a Monthly chart when using this indicator.
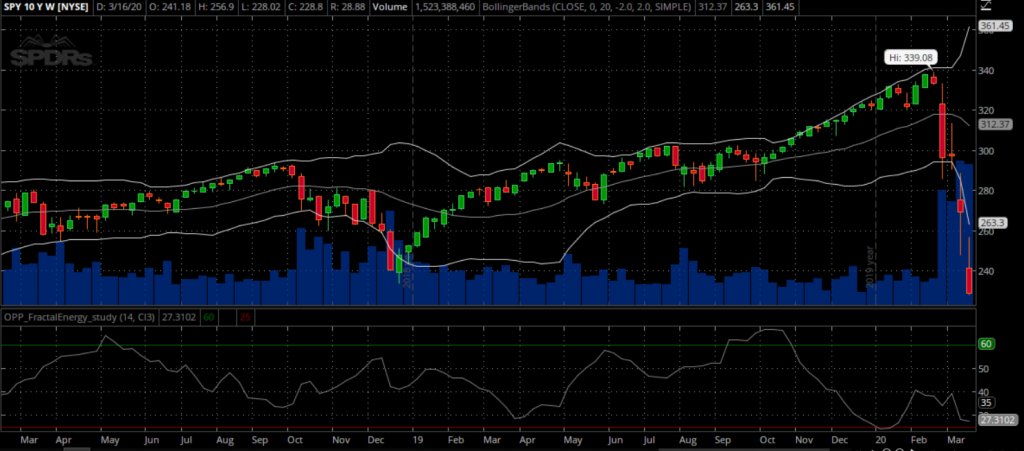
Source: Thinkorswim
When this indicator is plotted below the 20 line (the red horizontal line), it is considered to be “exhausted” in its movement.
And if this occurs, it is indicating that the stock has gone the majority of its move and has little left to continue onward without taking a break or “recharge” its internal energy.
In this case, the markets were extended and pressed up against the upper Bollinger Bands.
Now the waiting period begins as we look for a pull back in the stocks.
And we hit the motherload of a pullback!
Fractal Energy has successfully predicted and identified the turn around in the markets.
To time the point at which this thing pauses and turns around is critical to getting trades on the books.
Let’s take a look at the Daily timeframe for clues as to what is happening day-to-day.
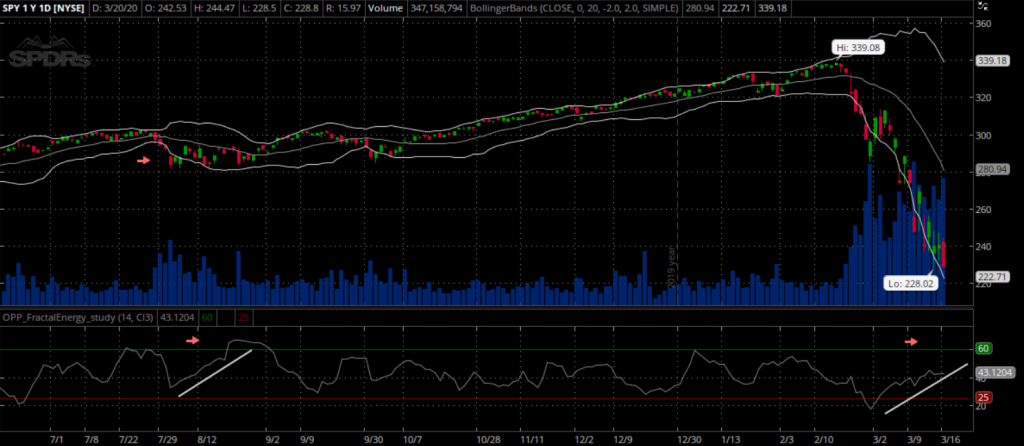
Source: Thinkorswim
After analyzing the Daily timeframe… there are two things that occurred with the Fractal Energy that signaled a “build up” of energy is occurring.
Like the markets in an uptrend, the same occurs in the downtrend. The Fractal Energy Indicator has to get back above the upper threshold into the exhausted line before a reversal can occur.
So what does that mean a trader can do ?
With this time of market… picking a bottom is definitely not advised.
But you have two options:
- Sit on your hands
- Start to sell put spreads below prior support levels
So let’s assume we are going to trade, and use the second option to get long the markets.
Now let’s take a look at a sample trading using my favorite option strategy to get long the stock market.
Next…
The Trade
At this point going long a stock directly is extremely dangerous for a trader given the market uncertainty surrounding the Coronavirus outbreak.
By buying stocks you are exposing yourself to significant losses on your capital as the stock continues to drop lower.
Here is a look at the risk profile of a long stock.
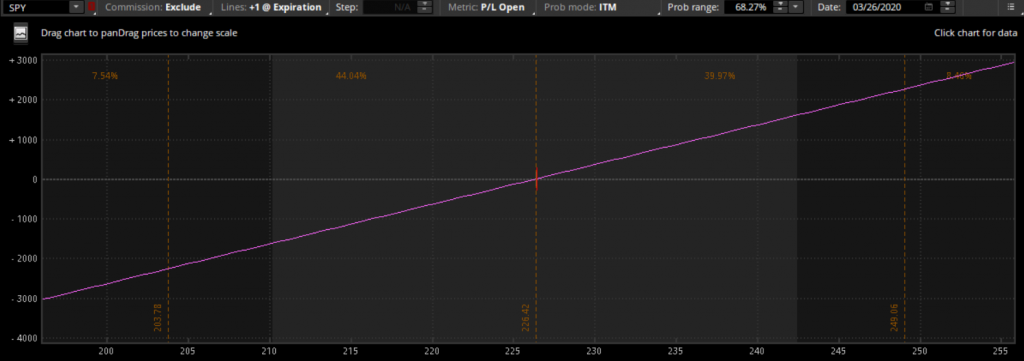
Source: Thinkorswim
And with the markets moving 10% on any given day, I don’t think it’s a great idea to purchase stocks at these levels.
So what’s the solution?
The best way to get long the markets at this point is to sell credit spreads!
And if a stock drops, goes sideways, or increases you can make money!
A credit spread is a directional strategy that requires a trader to buy an option that is at a nearby strike and sell an option that is at a further strike. Both in the same month and on the same stock.
This can be a highly advantageous choice instead of going long the stock directly….especially during extreme periods of high volatility like we are in now.
Here is an example of a credit put spread on SPY for your reference.
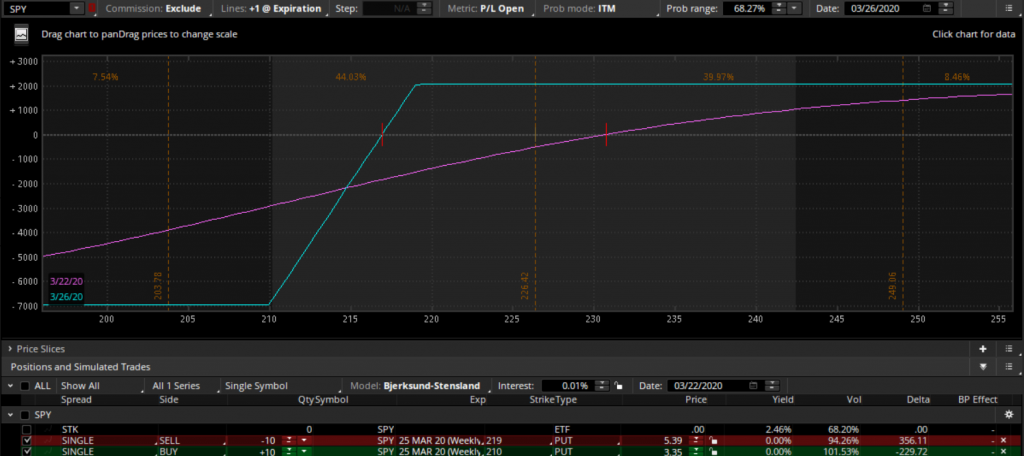
Source: Thinkorswim
How does this work?
The trade is set up by selling a nearby put and purchasing a lower (further away) put for protection.
As you can notice, this strategy offset all of the downside risk a trader will face. This strategy is known as a credit call spread and is placed as a neutral to bullish strategy for a trader to utilize.
The benefits of this strategy comes in 3 key points:
- Trade wins in a downward, sideways, or upward market.
- Paid upfront credit for this trade
- Limited downside risk
Conclusion
Trading credit spreads is a great way to generate income and also eliminate any risks associated when going long a market in periods of high volatility or high risk trading.
Let’s take a look at some pros and cons to trading credit spreads and covered calls.
Pros:
- House odds in favor of seller (60% or more)
- Limited downside risk compared to long stock
- Can win in up, down, and sideways markets
- Lower capital requirements vs owning stocks
Cons:
- Limited upside gains
It’s easy to see how the pros of trading this strategy significantly out-weight the cons!
0 Comments