It’s no secret, I use the fractal energy indicator to help improve my timing on my entries and exits.
It’s so powerful that over the last nine months I’ve only had one trading loss.
One of the top questions I receive is, Dave, the fractal energy indicator sounds interesting, but does it work during this volatile period in the market?
Now that’s a fair question.
Because it’s true, some indicators will simply stop working under volatile market conditions.
However, fractal energy is not one of them.
In fact, I’m going to show you it’s predictive powers right now and let you be the judge.
I promise you that you won’t be disappointed.
Options Profit Planner
Options Profit Planner is the powerhouse full-featured trading system that combines options, technical analysis, and the internal energy of the stocks. This cornerstone strategy scans, locates, and signals only the best-in-breed stocks that have extremely high probability of becoming profitable.
This technique is built upon the casino industry where the house, or options seller, is structured around collecting a steady stream of income each and every month.
By distributing their odds across many income streams (stocks) no one big winner will cause the casino to go bankrupt.
So, how exactly do we do that while trading options?
A steady stream of income can be achieved by selling options and spreads in order to put the house-odds in my favor.
But first, let’s talk about Fractal Energy and how it can be used to spot our next trade.
Fractal Energy
Fractal Energy is one of nature’s most beautiful mathematical equations, defining coastal patterns and snowflake designs.
Fractals are infinitely complex patterns that are self-similar across different scales. They are created by repeating a simple process over and over in an ongoing loop.
The power of fractals allows me to determine the strength of trends and how much “life” is remaining in a stock’s movement.
There are 2 main components of Fractal Energy:
1)Markets Fractal Pattern
2)The Internal Fractal Energy
The Markets Fractal Pattern is the way that fractals describe the various patterns of the markets, similar to how they are used to define undeniable properties of changing coastlines.
Fractals are also found from pine cones to aloe leaves, lightning paths, and many more unbelievable patterns.
The Internal Fractal Energy or Internal Energy, is a term used to describe the amount of potential energy, or stored energy a stock has accumulated over a specific time period. An easy way to think about stored energy is like water behind a dam. If the dam is damaged and releases the water, that force before the dam breaks is considered to be potential energy of water.
And by combining those two different components you create a single indicator that is able to successfully determine the strength or weakness of a trend on any stock.
Fractals tap into the inner strength of every stock across every time frame giving you the most comprehensive understanding of what a stock is going to do in the future.
Fractal Energy Indicator
Now let’s take a look at how Fractal Energy is able to predict trending markets or sideways markets.
Since we know that fractals and predict strong trends, it can also signal periods of “chop” in the markets.
So let’s take a look at some recent trades that combined Fractal Energy with technical indicators to show you areas of sideways markets.

Source: Tradingview
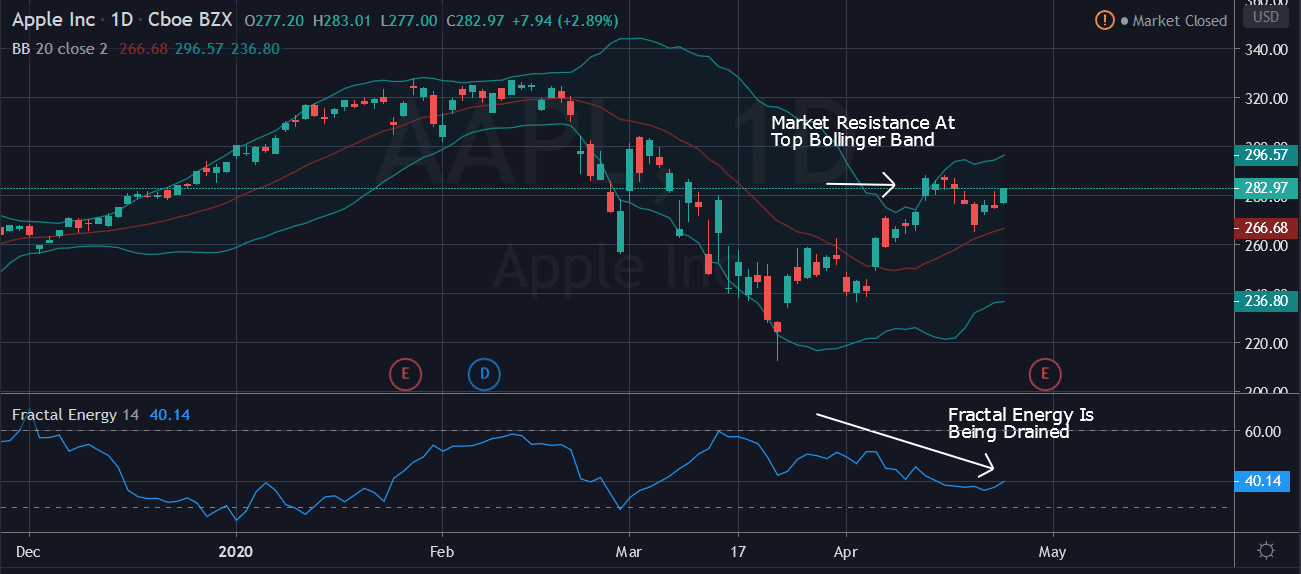
In this exam on AAPL, you can see two things that are important to this trade.
- The price runs into the upper Bollinger Band – this level is seen as a local area of resistance to many investors.
- Fractal Energy is depleting and not generating enough power to push the stock higher – there is no energy being generated to take the stock higher.
So, what does this indicate about the trade?
These two standout points are telling the trader that the stock is about trade sideways in a range and even in a “chop” with back and forth prices.
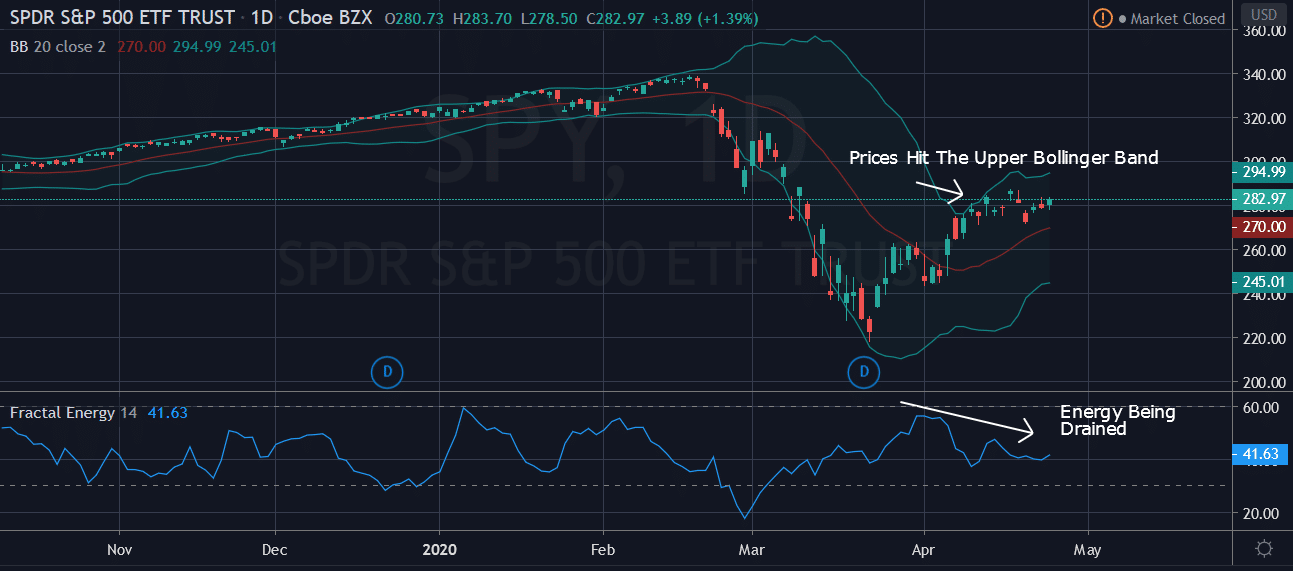
Here’s an example of a similar pattern on the SPY:

Source: Tradingview
Well there are two things that stand out immediately:
- The stock price is starting to approach key resistance levels at the upper band
- Fractal energy is starting to become exhausted.
What does this mean?
The Bollinger Band tends to act like ropes of a boxing ring, where price gets pushed back into the range.
And as we get close or breach the upper Bollinger Band, we tend to get a stall or pullback in price.
So as we approach these levels, a walk sideways or pullback forming a new higher-low stair step pattern is likely.
At this time, it’s best to take a look at higher time frames for supporting signals.
Supporting Time Frames
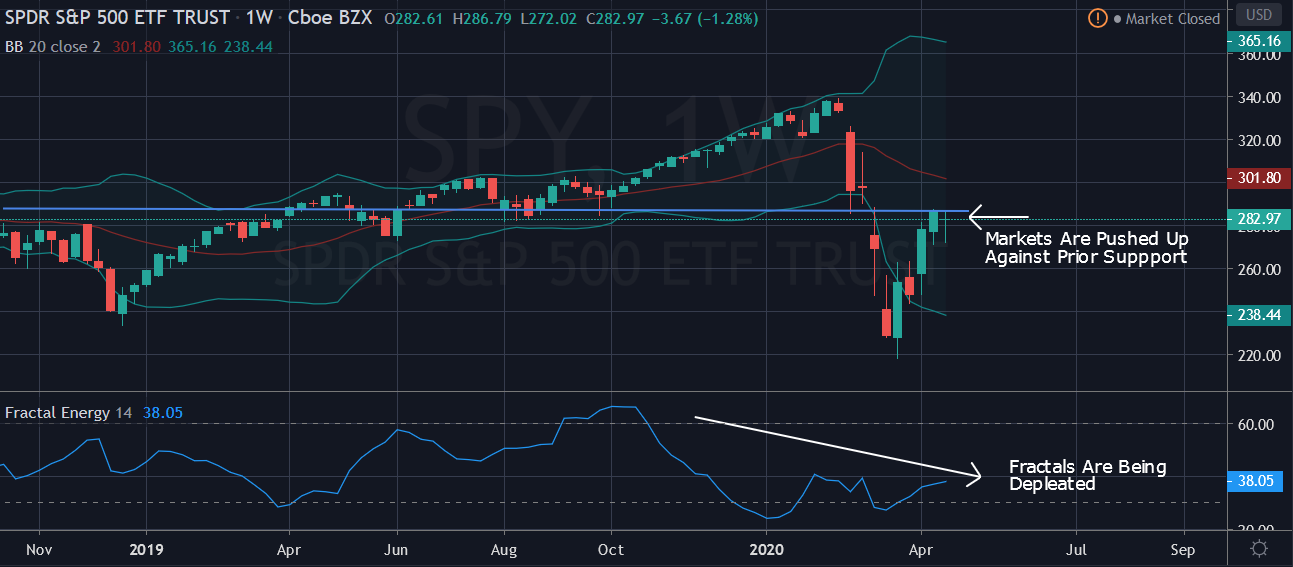
Now by looking at a higher time frame for what the stock is doing, we see a few key levels coming up.

Source: Tradingview
What I noticed from the Weekly chart.
- The markets have rallied from their lows and made a significant bounce from trading so far outside Bollinger Bands
- Stock rallied right to prior support, now current resistance
- The Fractals are still weak and showing near exhausted readings on the indicator
- Fractals could not generate additional energy to push the underlying stock higher
What does this mean for trading the SPY?
This means that the stock is at a point where it needs to rebuild some of that energy it has spent.
And like most trends, the SPY needs to go through cycles of regenerating energy after expending energy. But we cannot continue this trend too much longer since the upper time frames are not supporting this move much longer.
So, in order for the move to continue higher – regeneration can be done by either a pause or a slight pullback in the SPY.
The trade setup I’m looking for is the SPY’s Fractal Energy to regenerate back into the 50’s and become fully charged up again.
If this occurs, then Fractal Energy will be released and will drive the markets significantly higher throughout the summer.
So… let’s review a way a trader can get long the markets without having to buy any stock.
The Trade
One way to take advantage of a stale market is to use credit spreads to collect income as the premium decays away.
One strategy you might not have heard of is a credit put spread, and that’s the trade we are going to focus on when looking to go long the stock.
Definition: A credit spread, or net credit spread is an options strategy that involves a purchase of one option and a sale of another option in the same class and expiration but different strike prices. It is designed to make a profit when the spreads between the two options narrows.
Simply put – a credit spread strategy will make you money, while a debit spread strategy will cost you money.
This is the house vs the gambler.
And at Options Profit Planner, I want the house odds in my favor as the business owner and expect to have steady money coming in, not going out!
A credit spread involves selling a high-premium option while purchasing a low-premium option in the same stock and option type.
As a credit trader you have 4 strategies to generate income for your business.
The 4 main trades are:
- Short Put
- Short Call
- Short Put Spread
- Short Call Spread
In order to trade the SPY long, it would be best to implement a credit put spread.
Summary
A “fractal” is nothing more than a way to describe a never ending mathematical equation or pattern in nature.
And when you are selling options, you put the house odds in your favor!
Only then, once you then have a winning combination that can get you ahead of what the market is doing next, do you have the best shot at making money in the markets!
Now – start tapping into the inner workings of the stock market and make the Fractal Energy Indicator a cornerstone of your trading business!
To get started, Click here to sign up for Options Profit Planner now!

0 Comments