Analyzing and picking the right stocks to trade is often more art than science.
A stock chart can show strength and weakness, as well as, illustrate where investors feel the most greedy and fearful.
And like art, beauty is in the eye of the beholder.
Some traders can look at the same stock chart and have two totally different perspectives.
And somehow they both find a way to make that trade work for them one way or another.
So what’s a solution to this age-old problem?
Leveraging technology to help remove the guesswork.
And I do this every day with a simple set of tools.
Just give me a few minutes and I’ll explain to you how it’s possible.
It starts with taking shortcuts.
The shortcut I’ll be sharing with you today is all about filtering.
A process of narrowing down the thousands of tradable stocks, to just a small few.
Filtering The Markets
In order to filter the market – a trader needs to have a winning pattern that they wish to locate.
And when looking for stocks to trade, guessing is not the right thing to do as it can lead to disaster.
To filter for stocks, a trader will want to focus on key criteria that will narrow down the list as much as possible. For example, it is not recommended to apply a filter such as, price > 0.50, or price < 10,000 as you will not do much in terms of actual filtering.
Typically when filtering, a trader will want to start at the top and work his way down, narrowing the selection with each step he takes.
An example filter will be something like:
- NASDAQ only
- Price > 50
- Average Daily Volume > 2m
- Stocks only
Think you can scan without a filter?
No way would you be able to do it without software. With no filters applied to the markets, you have nearly 8000 stocks to sort through in order to pick your trade.
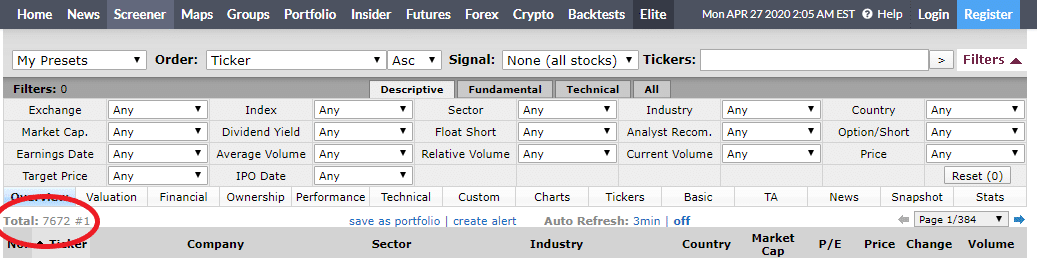
Source: Finviz
Let’s now apply a NASDAQ stocks only filter to this list and see how much is cut out.
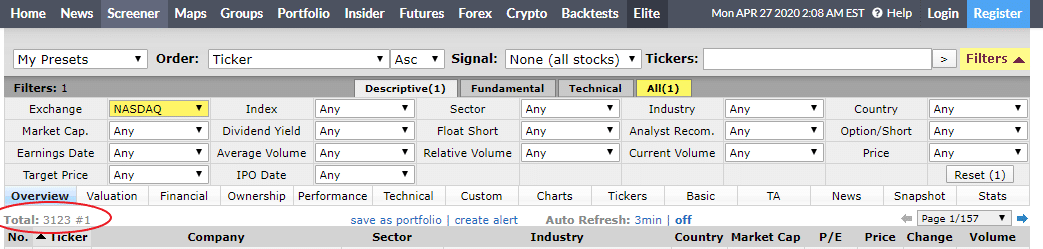
Source: Finviz
As you can see the total has been cut by more than half! So far, the filter seems to be working.
Next, let’s apply a price filter for all stocks that are over $50.
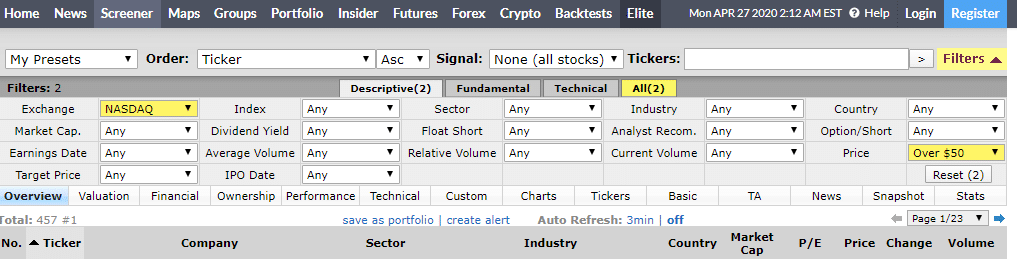
Source: Finviz
Now that we have applied a price filter to remove stock under $50 per share, we got our first significant jump lower.
By using only 2 filters, the total number of possible stocks to trade are under 500 total names.
As a hand trader, this is an acceptable number of stocks to review daily. But it’s still too much for me. Let’s see if we can get this down to 100 or less.
Next, let’s apply a filter for an average volume of greater than 2m shares.
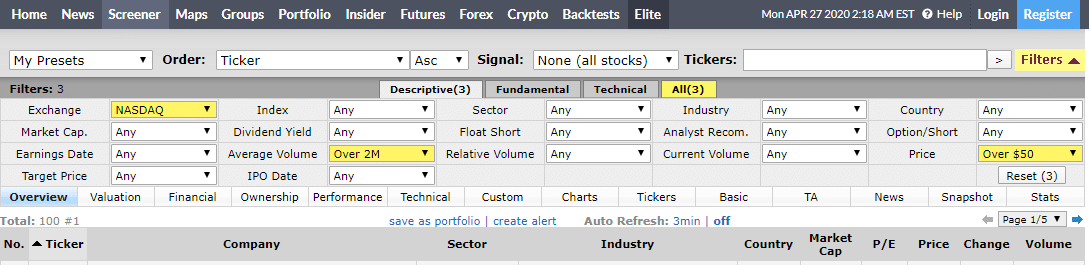
Source: Finviz
Finally, we are down to exactly 100 shares that we have to scan and filter manually to find the best trade.
But what if we wanted this list to be down towards 50-75? Let’s apply the final two filters looking for stocks only that are US based.
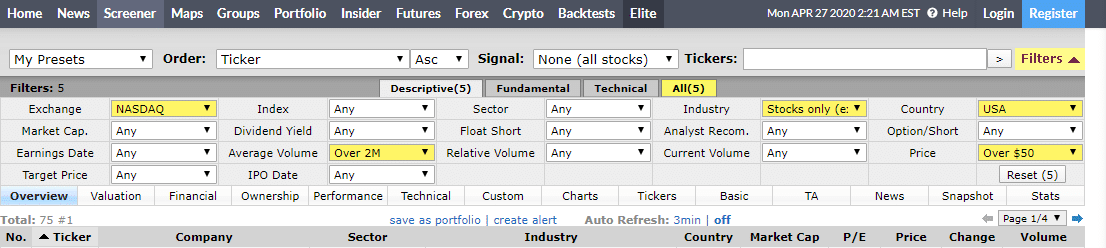
Source: Finviz
The filters above were just used as an example to filter down some of the largest and most traded names on the NASDAQ exchange.
That list does not really yield much value otherwise besides an example of the power of a “funnel” type system.
Let’s take a look at some of the ways that I filter for stocks that give me the best shot at finding winning trades.
Applying Filters For Credit Spreads
So, do you see the power of filtering down your stocks?
It’s important to remember that you want to apply filters that best fit your trading style instead of trying to get the total number of stocks as low as possible.
Sometimes there is nothing you can do but have to manually sort through 1k or more names.
Now let’s look about a few examples that you can use to find great setups to sell credit spreads around.
Support and Resistance
In order to find stocks to sell credit spreads that are going to be profitable, it’s best to focus on stocks that are trading at or near support or resistance levels.
Support and resistance are areas where traders continue to support or reject the price of a stock.
Some of the most important levels to buy stock at actually turn out to coincide with prior pivots.
Therefore, this creates a horizontal support that lets a trader assume if the price was to get back down to that level, buyers will step in and reverse the downward trend.
Here’s an example of the power of the horizontal support level in play on GOOGL.
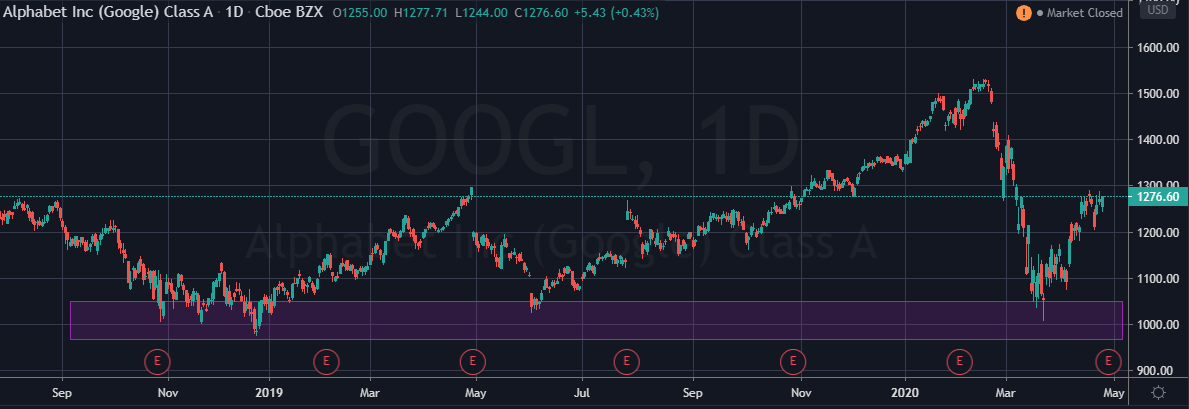
Source: Tradingview
As you can see on GOOGL, the price bounced off of the resistance zone from prior pivots that stretched back a year or further.
But in fact, any horizontal support level can work, but some of them are “stronger” than others.
Here’s another example of a double bottom pattern that sent the stock trading back up and past it’s highs.
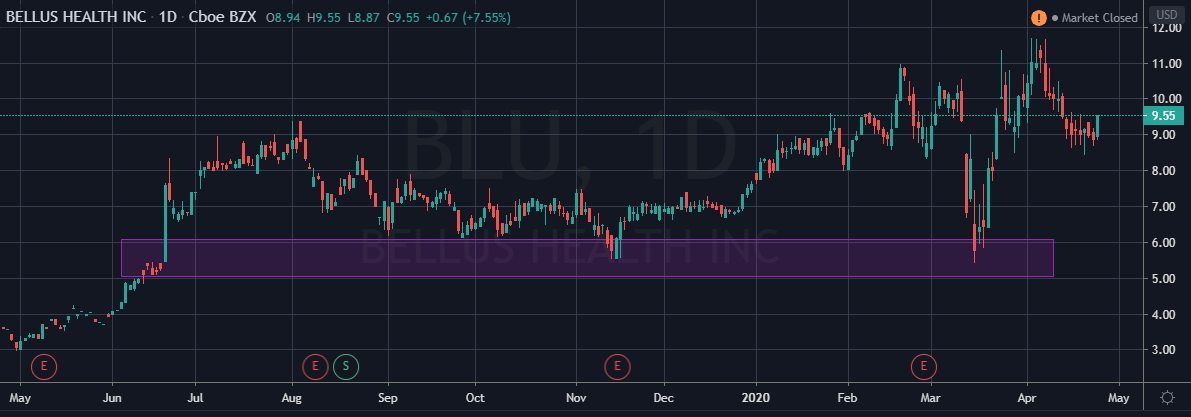
Source: Tradingview
In this case the stock didn’t have to get all the way down to its lows from earlier in the chart before it bounced at a pivot point (horizontal support) level that it found first.
Unfortunately, this pattern did work but it actually does not give the best odds of a bounce when it’s not at a major level such as a bottoming pattern found in a downtrend.
Pro Tip: For my own trading, I would like to locate a longer-term area of support that is supported by the stock trading into the 52-week lows.
Downtrend / Bottom Pattern
When filtering out chart patterns to trade, a simple and very effective way to get the best results possible is to use a direction filter.
What I mean is this.
Suppose you are looking to go long a stock – wouldn’t buying at the lows be better than buying at the highs?
The answer is most definitely, yes!
Let’s take a look at what this looks like.
Here’s an example of a stock trading at highs.
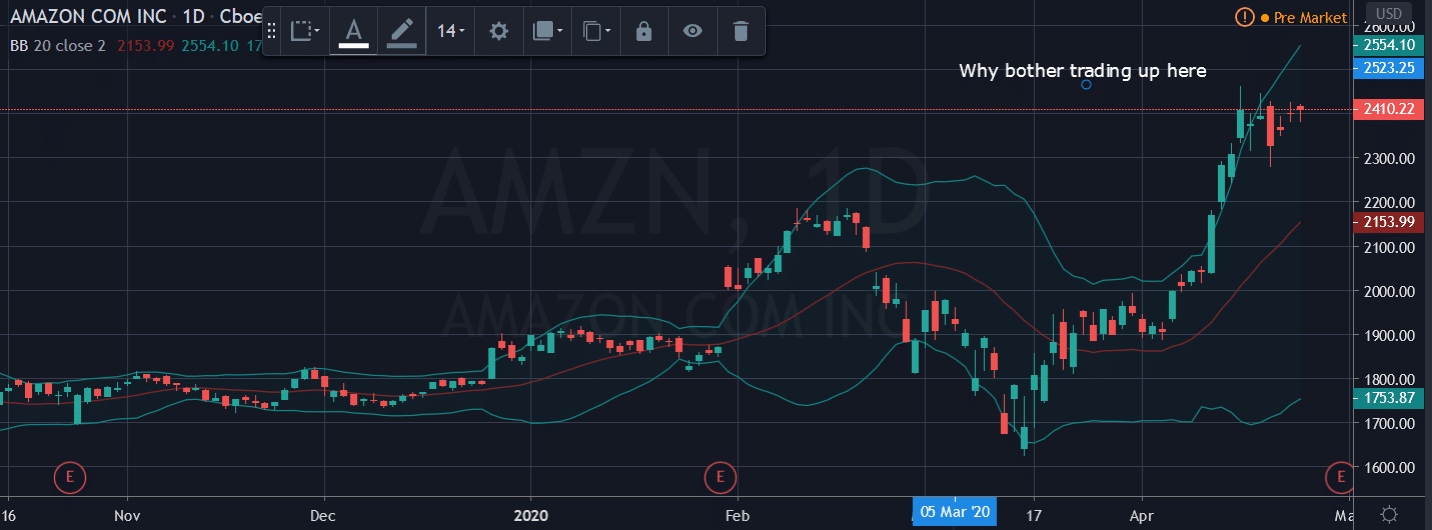
Source: Tradingview
Compared with…
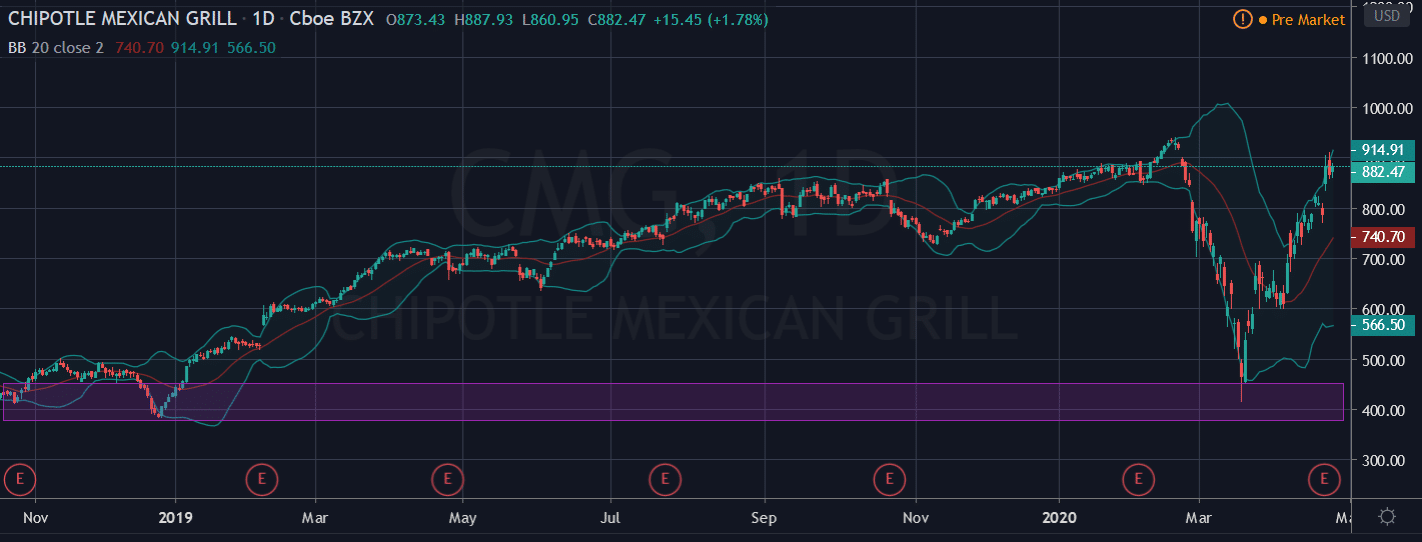
Source: Thinkorswim
Would definitely want to go long CMG at the bottom of that V- bottom
And that right there is a built in human filer that most people overlook when creating scanners to help them with their daily routine.
But instead of picking the “V” pattern, many traders go for the “W” or ”M” matters for market bottoms
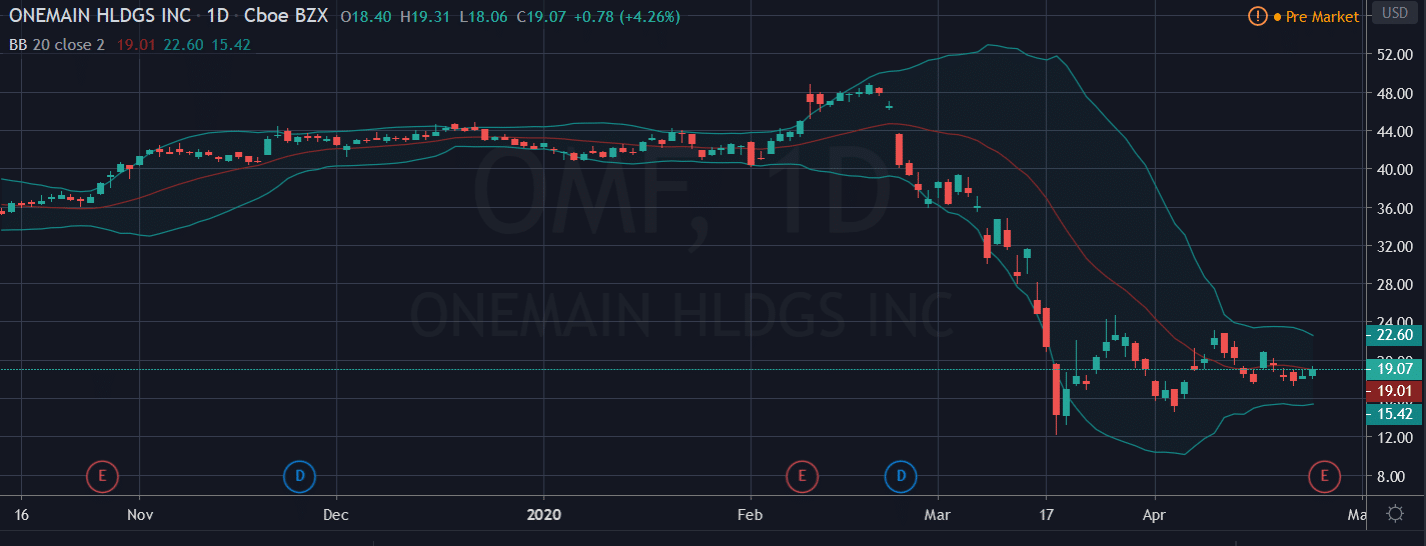
Source: Tradingview
One pattern I like to look out for is a bottoming pattern after a run lower on the stock price.
Pro Tip: When selecting this pattern, make sure the lower lows are increasing to confirm the bear flag is not taking over.
Additional Filters
And if you’re not happy with those filters above, here are some additional filters you can use too.
Filtering Sectors
Once the “big picture” is understood, it’s time to determine which sectors within the markets are driving any trends.
If the overall market is bullish, some sectors are likely to also be bullish, but some could also be bearish.
Likewise, if the overall market is bearish, some sectors are likely to also be bearish, but some could also be bullish.
If you are a trend trader, you would ideally want to identify the two or three sectors leading the trend.
In choosing two or three sectors, you have successfully narrowed down the stocklist into a small percentage of the market without having to focus on indicators or specific stocks.
Remember, the objective of filtering is to find the opportunity that fits your specific criteria as efficiently as possible… without looking at every chart in the market.
Filtering Stocks
Now, this is where the search gets more specific.
Just as you looked for sectors that were leading the market trend, you now want to look for the stocks that are leading the sectors. This process is designed to help you identify the strongest stock or the weakest stocks.
Once you have created a watchlist, you can filter it down even further in a few different ways.
Some ways to filter down stocks even further are:
- Filter stocks with prices above their moving average
- Uptrend breakouts
- Downtrend breakouts
- Patterns with increasing volumes
- Prices near support or resistance
And the list continues, and each trader has their own unique stock filter based on their trading strategy.
The idea is that once you have reduced your stocks to a manageable number, scan each chart manually and begin to choose the stocks that present the best opportunity that best fit your trading style and objective.
Summary
With a few steps and basic filters, you can effectively reduce thousands of stocks to a smaller qualified list that meets your specific criteria.
The goal?
To pick the stocks that align with your market outlook so you can make a more objective decision about what and when to trade.
There are also some various free tools that are available for you to use on the web. One of my personal favorites is finviz which I use to screen for my perfect trade.
Hungry for more knowledge?
0 Comments