Picking market bottoms is one of the most sought after skills that new traders want to learn.
These patterns show some of the most intense price action and risk/reward opportunities.
But unfortunately, many traders who try to catch the markets simply don’t have the skills or tools to do it quickly and accurately.
And this causes them to take serious losses – if not blowing out their account entirely!
And that’s where my proprietary market reversal indicator comes into action.
If a trader is equipped with the Fractal Energy Indicator they will be in a position where they can trade reversals with pin-point accuracy!
Options Profit Planner
When trading a strategy that is trend following it’s only a matter of time before you find yourself bored with the same trade.
And this can put you in a position where you are looking to trade different versions of the pattern, such as buy the dip and counter trend trade
What typically happens when a trader looks to go long a stock with options is they buy a call.
But at this point you are buying into some extremely high volatility and even though you pick the direction correctly, chances are the IV collapse will cause you to lose money on this trade!
But first, let’s take a look at a recent chart pattern that was traded and see what trades could have been taken to make a profit.
The Chart Pattern
As a trader, searching for stocks that are overbought or oversold is part of the job.
But you can’t just buy any old stock that reaches an overbought reading or touches the bottom of a Bollinger band.
That’s where Fractal Energy comes into the picture when looking for a level to buy the reversal.
Let’s take a look at a recent trade in Chipotle Mexican Grill, CMG, and how this played out.
Source: Tradingview
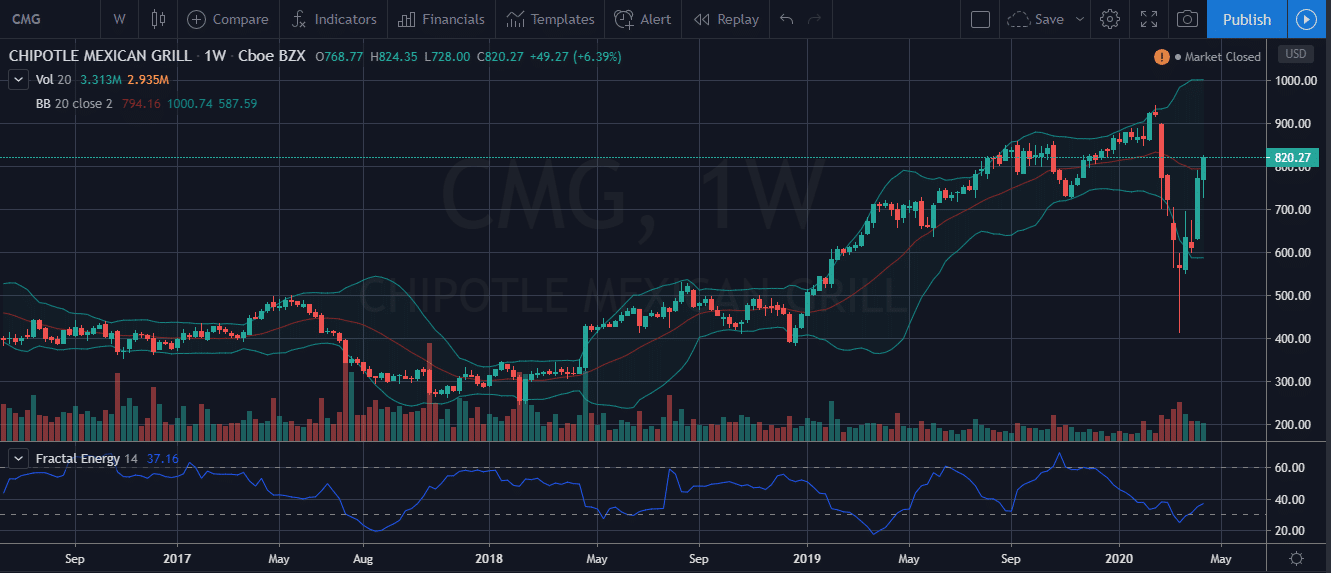
As you can see on the weekly chart, CMG spiked lower and sharply reversed back towards the all time highs.
And as a trader- those are the “V” bottom pattern you hunt and search for every day.
But if you were to simply buy CMG once it hit the Bollinger Band without using a secondary indicator, you would have been left holding serious losses.
This is where the Fractal Energy Indicator shows the stocks that are exhausted in their move and are set up to bounce.
Fractal Energy
The power of fractals allows me to determine the strength of trends and how much “life” is remaining in a stock’s movement.
There are 2 main components of Fractal Energy:
- Markets Fractal Pattern
- The Internal Energy
Fractals are found throughout everything in nature, from plants to shorelines… and even the financial markets!
Energy is the term used to describe the stored or potential energy of a stock.
Potential energy is like a spring that is compressed, that is ready to erupt when you release the force that is keeping it held together.
Which is similar to what happens in a stock when it’s making a “base” formation, generating enough energy to make its move higher.
And by combining those two different components you create a single indicator that is able to successfully determine the strength or weakness of a trend on any stock.
Chipotle Mexican Grill – CMG
Now that we have identified we are going to look to trade Chipotle Mexican Grill, lets see how combining the Fractal Energy Indicator with Bollinger Bands and other technical analysis tools to find an entry price.
Source: Tradingview
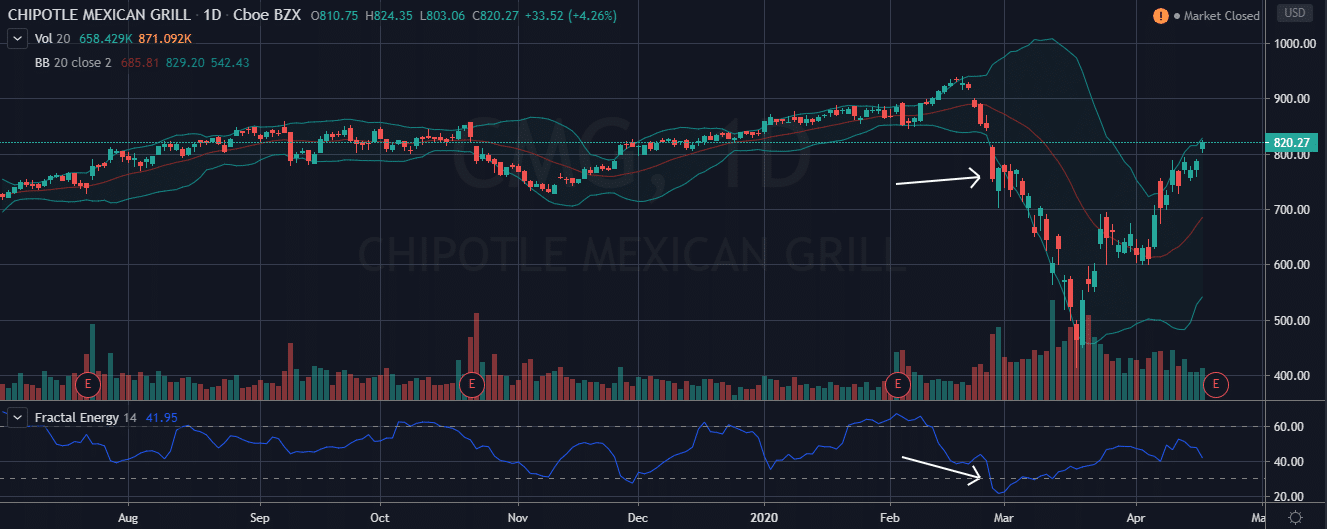
When looking at CMG on the daily timeframe, you can see that the Fractal Energy Indicator signaled an exhausted reading and the stock price traded below its Bollinger Band.
So that’s a buy signal, right? Not at all!
This signal would be a big mistake for the trader to take at this point.
Even though the two signals do align with a buy signal, Fractals is also the study of timeframes and therefore, you need to compare the daily timeframe with the weekly to see if any price action is going to impact the trade.
Let’s take a look at those same price levels but using the next higher timeframe.
Source: Tradingview
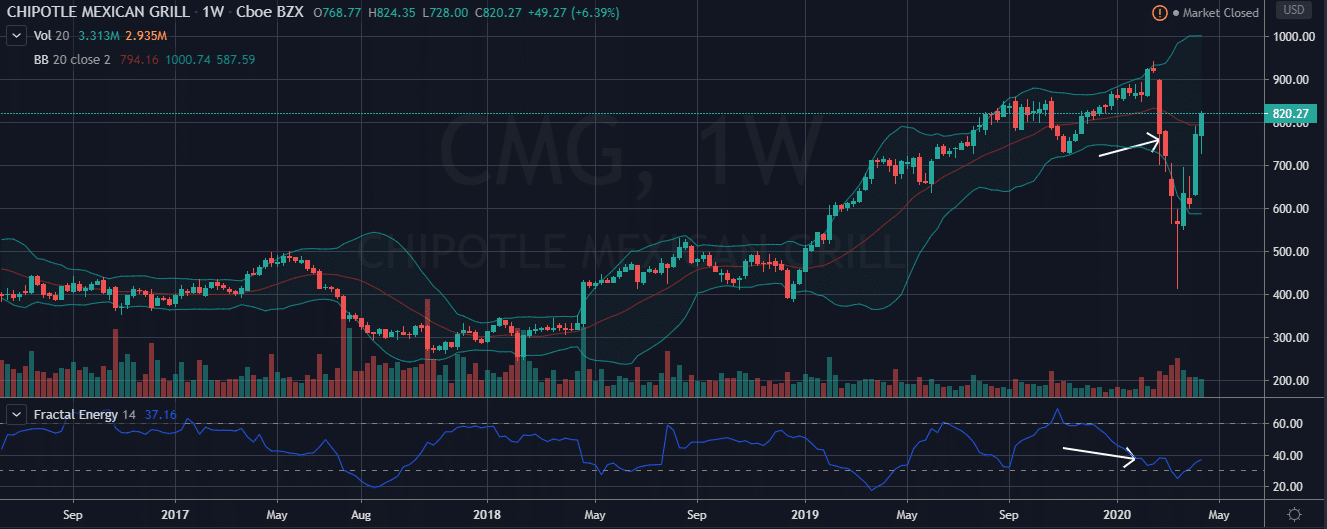
As you can quickly see, the stock appeared weak but the Fractal Energy Indicator was telling that there was still energy stored up to the downside.
And what happened next explains why you don’t want to blindly purchase a stock on a dip!
So what stood out to me in this chart?
- The stock price is falling through the Bollinger Bands on the daily and weekly timeframes
- Fractal Energy is not depleted or exhausted on the daily timeframe but it’s starting to get to depleted levels
What do we expect?
The Bollinger Bands act like ropes of a boxing ring, where price gets pushed back into the range of the two bands .
And when you get close to the top or bottom bands, price can push through it and continue.
When this happens it’s best to go to the next time frame for a supporting signal.
Let’s take a look at how the trade plays out on a weekly chart.
Source: Thinkorswim
In this chart you can see two things:
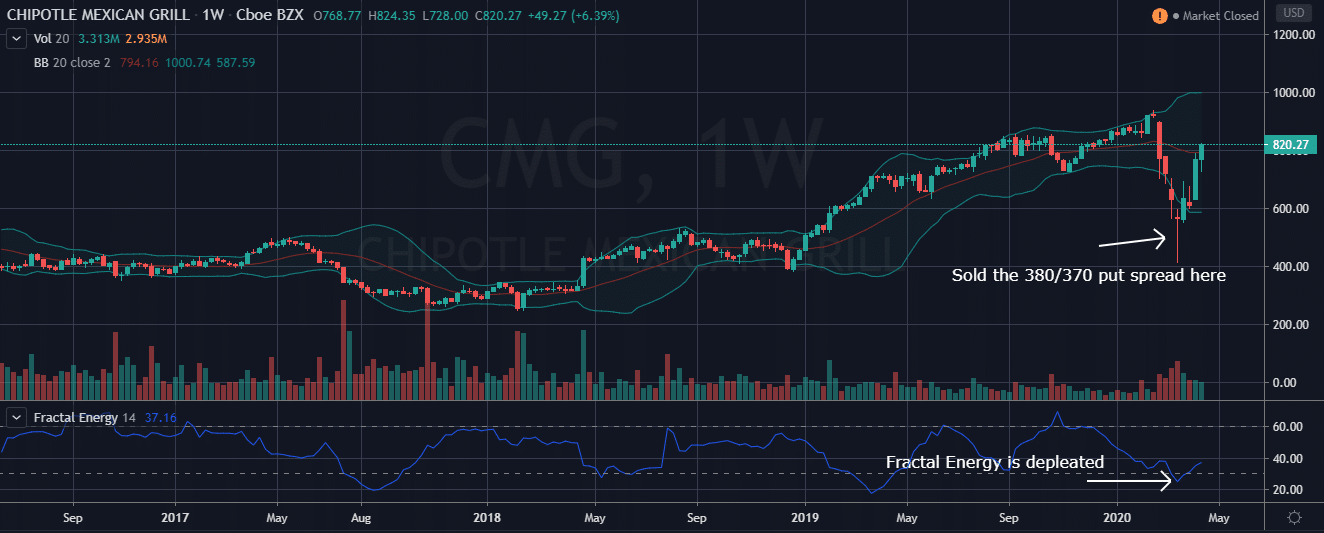
- The markets have continued to sell off and bounced from their lows
- Fractals are exhausted and fully depleted and appear to be generating energy before heading higher.
What does this mean for CMG?
This means that the stock is at a point where it needs to rebuild some of that energy it has spent as it sold off.
And like most trends, the CMG needs to go through cycles of regenerating energy after expending energy and making a full reversal.
This is an example of how if you waited for the Fractal Energy Indicator to reach depleted levels on the Weekly time frame before taking a trade off of the daily time frame.
The Trade
After seeing this price action, I decided to sell the Sept ’20 $380/370 put spread for $1.25.
Sell Sept ‘20 380 @ 5.00
Buy Sept ‘20 370 @ 3.75
Total Risk: $10.00/contract
Total Profit: $ $1.25/contract
This trade executed a short put spread to collect the premium on expensive options contracts.
Definition: A credit spread, or net credit spread is an options strategy that involves a purchase of one option and a sale of another option in the same class and expiration but different strike prices. It is designed to make a profit when the spreads between the two options narrows.
Simply put – a credit spread strategy will make you money, while a debit spread strategy will cost you money.
Wrapping up
For my trading I make sure that I utilize an options trading style focused around credit trading to generate income for my business.
Since trading is a business, I always focus on the money coming in and the money going out!
Credit spreads give unique advantages to traders over debit spreads, with the most important being that you are paid upfront to place a trade!
And as a business owner, I want to make sure I know how much money I have coming in and out each and every month.
Since running a trading account is actually a business and not a trip to the casino!
To learn the process I use day in and day out to lock in consistent profits, click here to sign up today!
0 Comments