Today I want to talk to you about technical analysis and how to improve your trading by implementing a few simple indicators.
It’s important, because without it, you could lose a lot of money or not make enough—because of poor execution.
The levels in which you enter a trade, can mean the difference between extremely profitable and being a perennial loser.
To keep you off the losing side, I’ve put together this quick tutorial on technical analysis.
Even if you never become a technical trader, it’s important to know this, because if you can gain insight on how other traders in the market react—you’ll have an edge over them.
Technical Analysis
When it comes to trading the financial markets, it’s more about psychology than it is mathematics.
The financial markets are just a way to express the value of a company through the greed or fear of the investor.
If an investor feels safe, they are willing to put risk-on and buy stock.. This in turn drives greed in the chase of profits.
Alternative, if investors are uncertain about the future, they will stop buying stock or begin selling the stock they own due to fear of the future and the desire to have risk-off.
But simply reviewing a stock chart doesn’t tell the entire picture… you need tools that help you decipher exactly what is happening
This is where technical analysis comes into action.
Two main technical analysis patterns that I like to focus on are support/resistance levels and consolidation patterns.
These two patterns are important as a trader since they can give you some of the largest moves to make money quickly.
Support / Resistance Levels
Among all the aspects of technical analysis, perhaps the most important and actionable concepts are support and resistance zones.
Many other aspects of technical analysis, such as price action analysis, are based on the key concepts of support and resistance.
Support is a term used to describe a low price level that a stock reaches but does not exceed over a period of time.
Resistance is a term that describes a high price level that a stock reaches but does not exceed over a period of time.
One way you can find support and resistance levels is to draw lines on a chart that connect the lows and highs of a stock price. These lines can be drawn horizontally or diagonally.
It’s important to remember that support and resistance levels are estimates and not necessarily exact prices. Try focusing on support levels as “zones” when identifying these key levels.
Let’s take a look at how to identify support levels in AMZN…
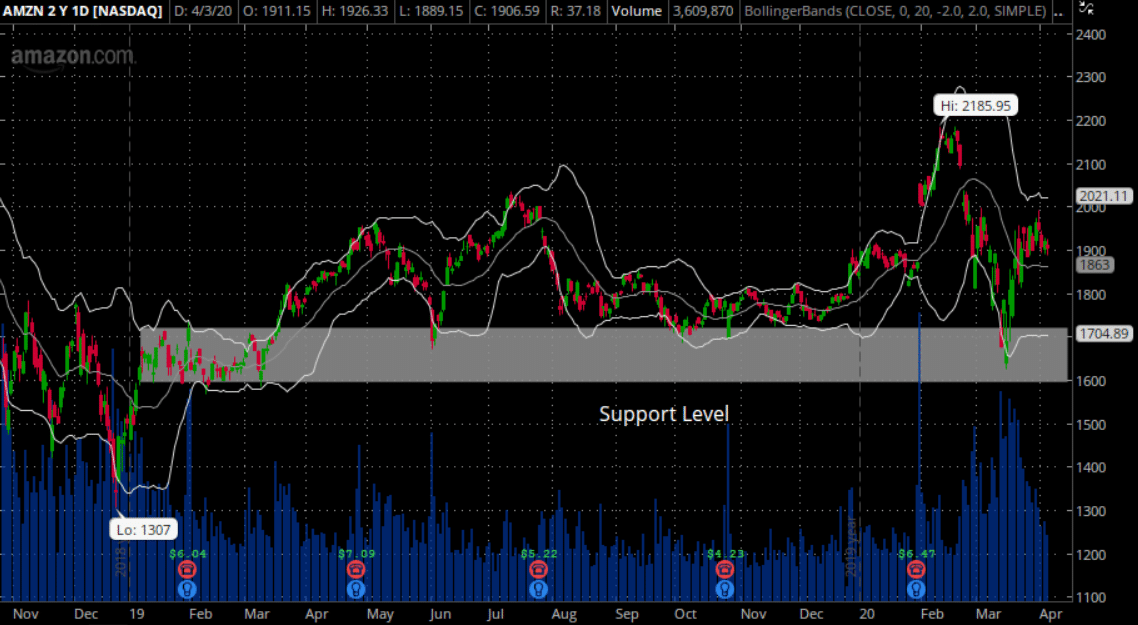
Source:Thinkorswim
As you can see in the chart, there was a series of lows that kept the price of the stock moving higher. Everytime AMZN traded down into these levels, it experienced higher trading with near-term bullish price action.
But that’s not the only pattern that can signal a significant market move.
Another pattern that can signal a massive breakout is around the corner, is the Symmetrical Triangle.
Let’s take a look at how these partners work and what to expect..
Symmetrical Triangles
A symmetrical triangle is a chart pattern characterized by two converging trend lines, typically drawn connecting recent lows and highs.
When trading a Symmetrical Triangle pattern, a trader is expecting a breakout to occur in the near future, but they are not sure which direction the stock might go.
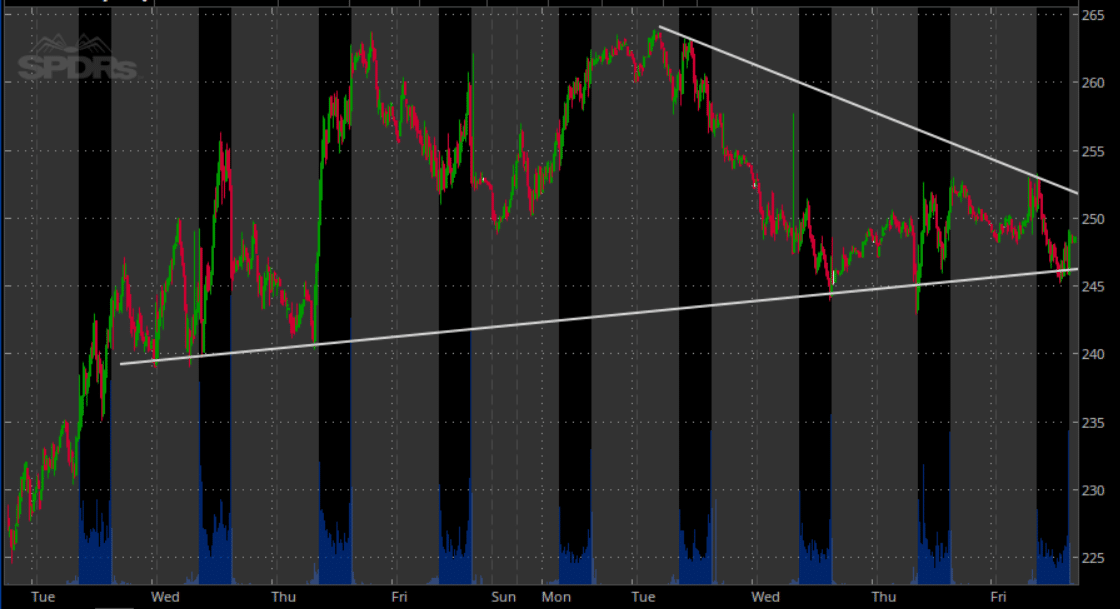
Source: Thinkorswim
As you can see, the SPY is getting ready for a breakout and it’s expected to come soon.
So what is the expectation of the symmetrical triangle?
Symmetrical triangles are expected to breakout higher and typically have higher volume seen on the move.
Pro tip: As with most forms of technical analysis, symmetrical triangle patterns work best in conjunction with other technical indicators and chart patterns. Traders often look for a high volume move as confirmation of a breakout and may use other technical indicators to determine how long the breakout might last. For example, the Relative Strength Index (RSI) may be used to determine when a security has become overbought following a breakout.
Wrapping up
The strategy used at Option Profit Planner aims to find trades that are trading near support levels or are setting up for a breakout to higher prices.
And since Options Profit Planner focuses primary on short puts – we can always aim to collect the shares and hold it for a move higher.
Want more proof that selling options is the only way to consistently make money?
*Looking for actionable trade ideas? Join me live on April 8th, at 2P ET, as I go live. Click here to sign up!
0 Comments