It’s difficult to wake up every morning and try to come up with trading ideas.
Perhaps you are screening for stocks with the highest volume on the previous day.
Or maybe you heard Jimmy C. screaming “BUY BUY BUY” so you follow along…
Let’s be honest, they probably aren’t the best signals out there.
However, the Options Profit Planner puts you a step above the rest…
All thanks to the power of Fractal Energy.
Allow me to explain…
Options Profit Planner
Fractal Energy is considered the most powerful mathematical equation that is used to solve the unsolvable. Fractals are used in defining coastal patterns and snowflake designs.
A fractal is a never-ending pattern. Fractals are infinitely complex patterns that are self-similar across different scales. They are created by repeating a simple process over and over in an ongoing loop.
When searching for ways to tap into the inner workings of the stock market, I knew right away Fractal Energy would do the job!
Fractal Energy Indicator
The power of fractals allows me to determine the strength of trends and how much “life” is remaining in a stock’s movement.
And I must say, there are some ominous signs coming out of the fractal indicator.
But first, there are 2 main components of Fractal Energy that you need to know.
Two components:
- Markets Fractal Pattern
- The Internal Energy
Energy is the term used to describe the stored or potential energy a stock has built up.
Like a spring that is compressed, it stores potential energy and erupts when you release the force that is keeping it held together.
And by combining those two different components you create a single indicator that is able to successfully determine the strength or weakness of a trend on any stock.
Fractals tap into the inner strength of every stock across every time frame giving you the most comprehensive understanding of what a stock is going to do in the future.
Bollinger Bands
Bollinger Bands were developed by John Bollinger as a price envelope designed to define the upper and lower price range levels of a stock.
Bollinger Band Indicator consists of a middle Simple Moving Average (SMA) along with an upper and lower offset band. Because the distance between the bands is based on statistics, such as a standard deviation, they adjust to volatility swings in the underlying price.
How do you read them?
Bollinger Bands help to determine whether prices are high or low on a relative basis, and according to these calculations, price should fall within range 95% of the time!
How this indicator works:
- When Bollinger Bands tighten, there is a high likelihood that price will have a sharp move
- When the bands separate by an unusually large amount, this is showing a significant increase in volatility or a gap in stock price.
- The stock price can exceed and even hug or ride the band price for extended periods of time.
- Price has the tendency to bounce within the bands’ envelope, touching one band and moving back towards the other.
- You can use the middle SMA or opposite band as target prices and exits for your trading
- If prices move outside of the band, it’s expected to see a trend continuation until the price moves back inside the band.
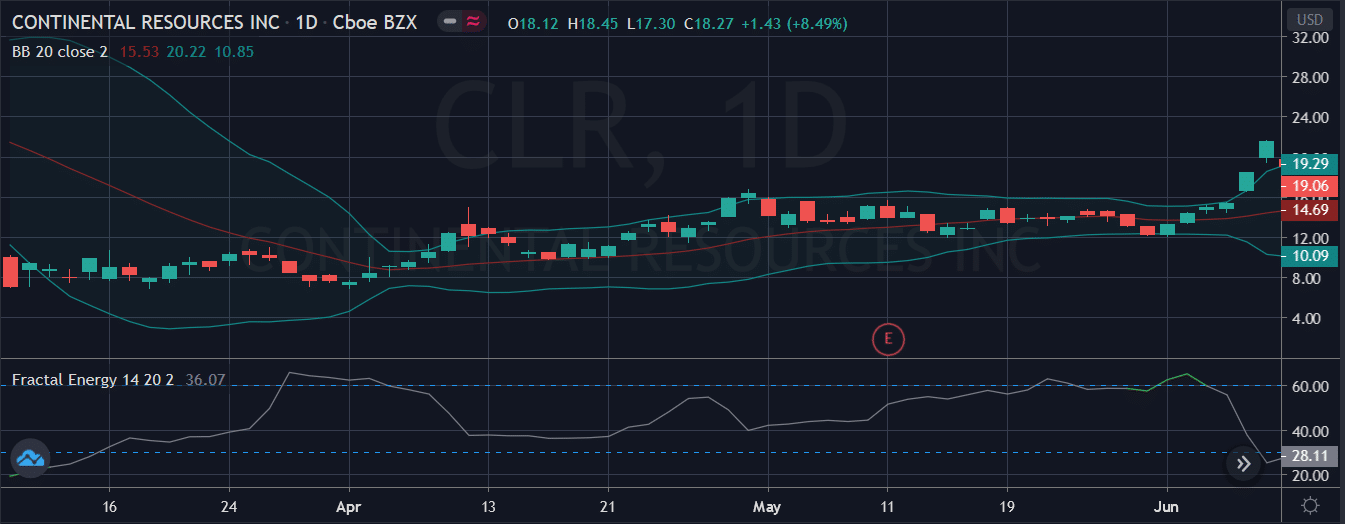
Source: Tradingview
In a quick glance the trader will see :
- Tightening of bands leads to breakout
- Stock trends higher, riding upper band
- Trader can buy the moving average the entire way up
- Price goes above or drops suddenly below lower band and snaps back inside acting as a price barrier
So, how does this apply to my trading?
Let’s review the trade CLR that was taken last week.
Placing The Trade
Here is a look at the CLR chart again with more details.
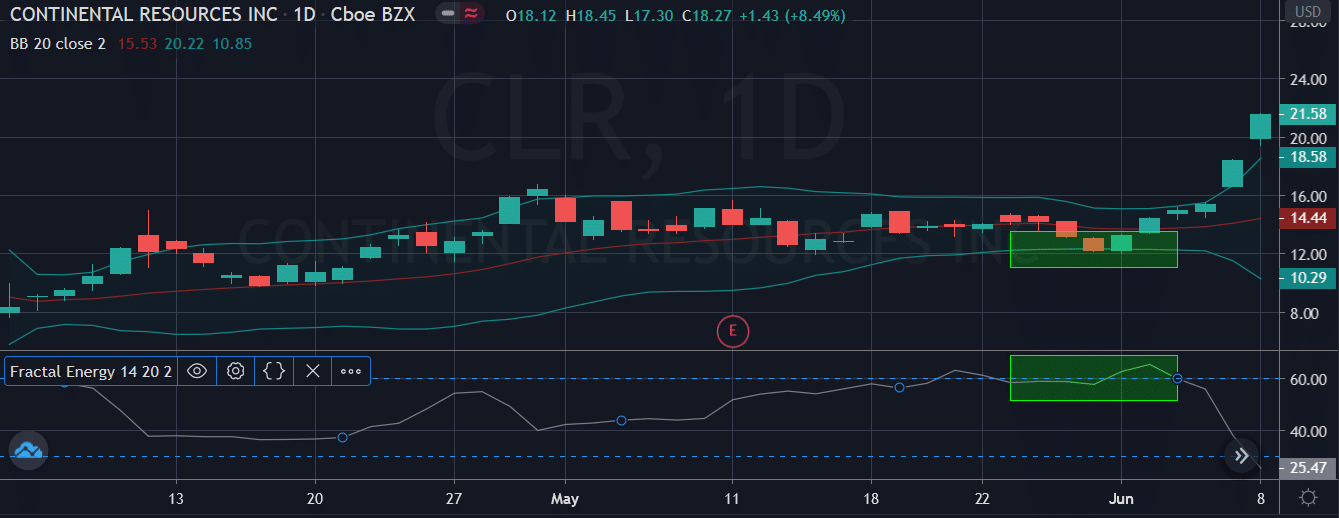
Source: Tradingview
Here you can see the price is trading under the Bollinger band and that the Fractal Energy Indicator is in the Fully Charged state.
The trade: CLR: I sold the Sept ’20 $5 put for $1.00.
And at Options Profit Planner, I want the house odds in my favor as the business owner and expect to have steady money coming in, not going out!
As a credit trader you have 4 strategies to generate income for your business.
The 4 main trades are:
- Short Put
- Short Call
- Short Put Spread
- Short Call Spread
In order to trade CLR short, it would be best to implement a Short Put Strategy
Wrapping up
Trading isn’t simple and requires a sound strategy in order to find trades and execute accurately.
When you are selling options, you put the house odds in your favor!
Only then do you then have a winning combination that can give you the best shot at making money in the markets!
Now – start tapping into the inner workings of the stock market and make Fractal Energy a cornerstone of your trading business!
To get started, Click here to sign up for Options Profit Planner now!
0 Comments