It’s hard to believe but the market was at record highs a little over a month ago now…
This is a move that caught everyone off guard— a bonafide “black swan” event.
But there was one thing that might have known it was coming…
A few weeks earlier, the markets gave us an ominous sign. This sign indicated that stocks were running out of steam.
But it’s not something you would have picked up on a standard stock price chart.
Not long after the markets signaled total exhaustion in their Fractal Energy… they plummeted lower…
How did that happen?
Well…that’s because Fractal Energy is found throughout nature and the entire market!
And now it’s starting to signal a bottom in this selloff!
So before you get out there and buy stocks… let’s take a look at what exactly Fractal Energy is telling us where we go next.
What Is Fractal Energy
Fractal Energy is the cornerstone indicator of Options Profit Planner and its power is used to pinpoint key market reversals.
The power of fractals allows me to determine the strength of trends and how much “life” is remaining in a stock’s movement.
There are 2 main components of Fractal Energy:
- Fractal Pattern
- Energy
And when you use the power of this indicator you will be able to successfully determine the strength or weakness of trends on any stock.
Let’s take a look at how this works…
The Weekly Chart
By using Fractal Energy Indicator, Options Profit Planner has been able to predict this move down and this bounce almost perfectly!
And the way to predict larger market movements is to reference a longer time frame to understand what the major trends are doing.
Let’s take a look at SPY’s with the Fractal Energy plotted…
Source: Thinkorswim
Here is how this breaks down…
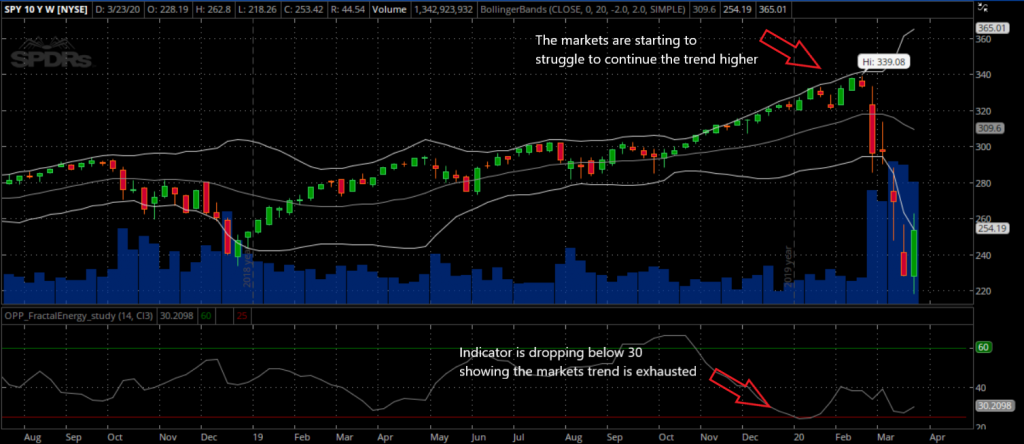
Breaking down what Fractals said about the markets at all time highs:
- The Fractal Energy indicator dropped to new lows, below the lower threshold value of 30
- Markets struggled to continue trend higher, showing weakness in the stock
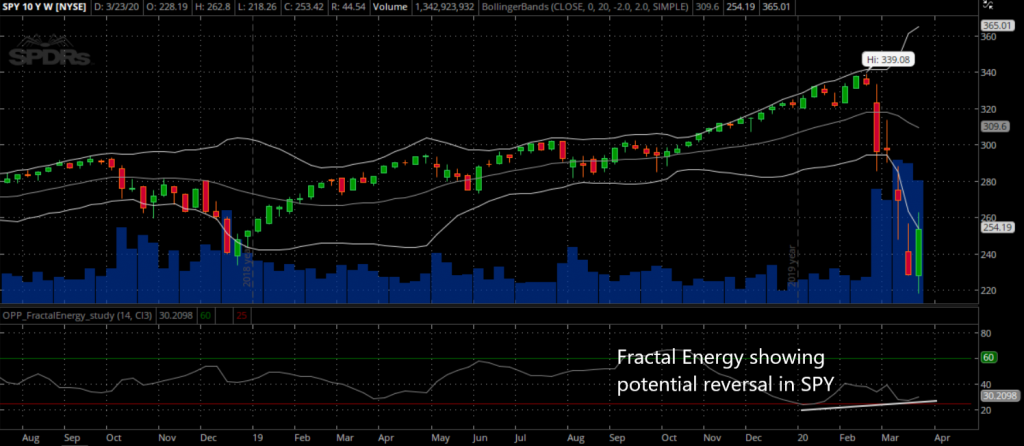
And now that the markets are seeming to be putting in a bottom, this time frame is
Now that the Weekly chart is showing a possible trend reversal in the markets, let’s take a look at the Fractal Energy on the daily timeframe to see what’s going on.
Source: Thinkorswim
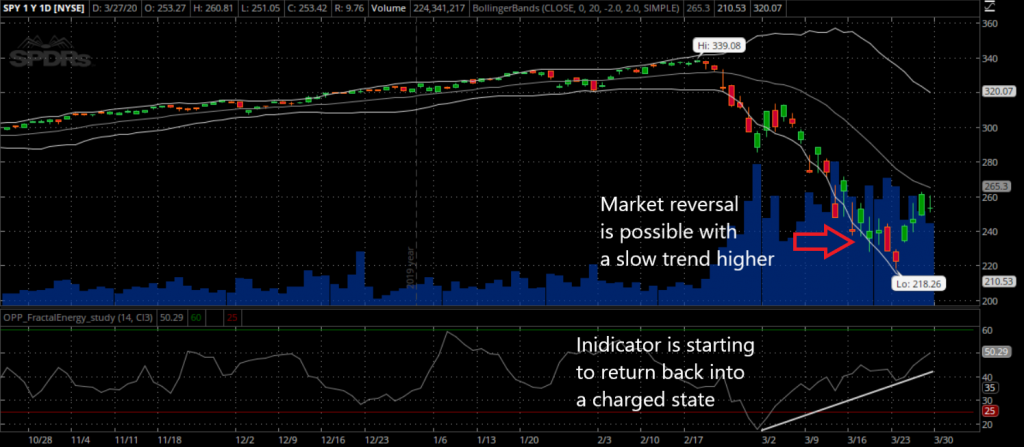
The Fractal Energy fell below the lower threshold that is showing exhaustion in the stock’s tred.
As the indicator continues to move higher, this is showing that the markets are ready to slowly trade higher.
When the markets trade sideways or higher they collect energy and store this energy before making its new trend, either higher or lower.
The Daily Chart
Once the trend or reversal is identified on the Weekly (or Monthly) timeframe, it’s best to then reference the daily time frame and see what the indicator is projecting.
Now… let’s take a look at the fractal energy and see what is happening on the daily time frame.
Source: Thinkorswim
After looking at the Daily timeframe, there are two recent things that occurred with the Fractal Energy that signal a “build-up” of energy is occurring.
Key points:
- The Fractal Energy indicator fell from “charged values” to “exhaustion values”, or value less than 25.
- Fractal Energy is building back up to “charged”, showing the stock is getting ready to trend again
As the indicator dropped below the 25 value, it is considered to be “exhausted” from the downmove and a trend higher or lower is imminent.
And since the indicator rose back above the lower threshold, it is recharging the energy in the markets.
This “recharge” is needed before the market is going to be able to try and regain some ground that was lost in the past two weeks.
So what does that mean a trader can do?
Let’s take a look at a sample trading using my favorite option strategy to get long the stock market.
Next…
The Trade
Now that we believe the markets are going higher, let’s take a look at a trade we can place on a stock using his indicator.
Source: Thinkorswim
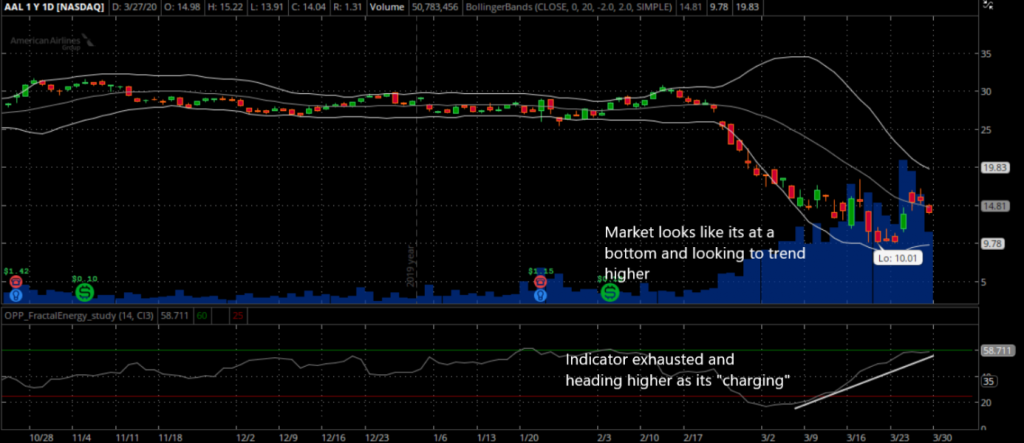
Key points from analyzing the stock chart:
- The daily bars appear that they are ready to bounce back from the sell-off
- Higher lows looking to form to confirm uptrend
- If low might be tested, it must hold
- The Fractal Energy is getting “charged up” showing the stock is ready to trend again
The way to trade this stock is by either selling naked puts or trading a credit spread.
The Credit Spread
Trading a credit put spread on the markets to provide downside protection. Another benefit of trading a credit put spread is that the odds of a winning trade are greatly in your favor.
If a stock drops, goes sideways, or increases you can make money in this position!
Let me explain…
A credit spread is a directional strategy that requires a trader to buy an option that is at a nearby strike and sell an option that is at a further strike. Both in the same month and on the same stock.
This can be a highly advantageous choice instead of going long the stock directly… especially during extreme periods of high volatility.
But for ease of trade management, I am going to go with a Naked Put strategy.
Naked Put
Since spread trades can be more difficult to trade than naked puts, we are going to place a short put trade on AAL.
By using Support as a place where the stock should bounce, we are going to target selling Put contracts that are below that level.
For your reference, here is a chart of AAL and the options on the stock.
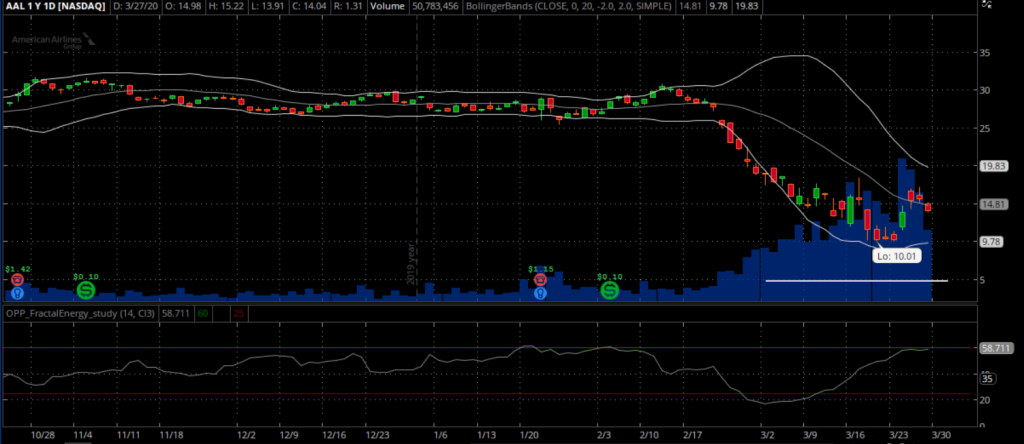
Source: Thinkorswim
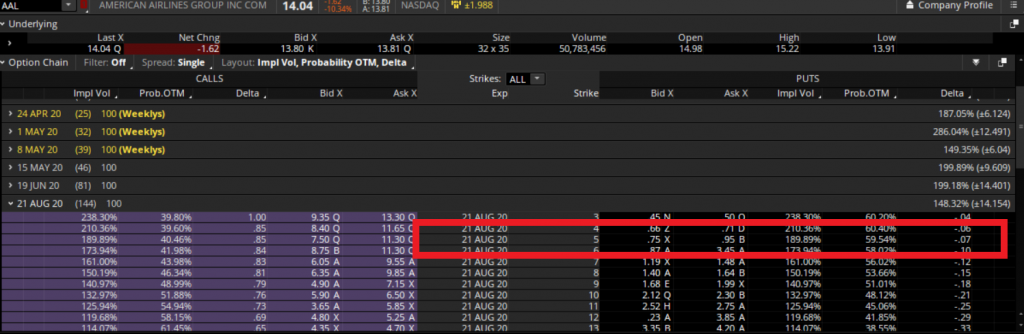
Source: Thinkorswim
Why do I want to trade a naked put instead of a credit put spread?
Well I feel comfortable with owning AAL at a price that is over 50% lower than the current trading value of the stock.
Here’s what I think…
I also want to focus only on naked puts at this time as they are easier to manage and defend. For example, I am putting new trades in on DAL and AAL this week. Why? First, they are at strikes over 50% lower than where the stocks are currently priced and second, I believe the airlines will get a bailout like in 2001.
Wrapping Up
When trading with Fractal Energy, a trader can find market reversals that can put them in a position to generate significant income from selling puts or credit spreads.
By selling puts or a credit spread, the trader will make full profits by the options expiring with little or value.
Additionally, the put seller will be able own the stock at their desired levels and turn this position into an investment. And once they own the stock, the trader will be able to ride the price higher after the selloff is over.
And that’s why Fractal Energy is the cornerstone indicator of Options Profit Planner!
To see more trades like AAL and how to use the fractal energy… Click Here To Join Options Profit Planner Today!
0 Comments