When a market is this unpredictable I need to have a strategy that can keep me level headed.
And that’s exactly what I developed with Options Profit Planner.
After all – it’s hard enough to manage risk and trade a portfolio of stocks without having a system in place to streamline finding trades.
How do I do this?
I created a system that is based on technical analysis and Fractal Energy to find the stocks that are set up for trading credit spreads on.
So if you’re looking for a better way to find your trades and cut through the noise…
Options Profit Planner
While technical analysis is a huge and complex area of trading, it’s important to stay focused on only one or two main indicators to help your trading style.
Since it’s easy to get overloaded, let’s review two of my favorite technical analysis indicators that help provide short to medium term support and resistance levels for a stock.
And I combine this with my proprietary indicator, Fractal Energy, to give me a heads up as to when the stock is going to rip or stall out.
Now…let’s review the two indicators.
Fractal Energy
Many traders spend hours hunting trading opportunities by looking at charts and patterns they see in the markets.
But this is really only a two-dimensional analysis of what’s going on in the markets. Most technical analysis tends to lack the research into the internal energy of a stock’s price.
It’s just a time-consuming process and that’s why many traders just take the shortcut to read charts as fast as possible.
To cut down the work that I have to do every day, I focus on stocks that meet qualifications set by the Fractal Energy Indicator.
When looking to understand what price action is doing you need to reference information other than a basic stock chart to get a true edge in the markets.
And by having an indicator such as the Fractal Energy indicator you can determine stocks that are charged to run or exhausted and ready to stall out.
What are fractals?
The power of fractals allows me to determine the strength of trends and how much “life” is remaining in a stock’s movement.
There are 3 main components of Options Profit Planner:
- Markets Fractal Pattern
- The Internal Energy
- Bollinger Bands
By combining those two different components you create a single indicator that is able to successfully determine the strength or weakness of a trend on any stock.
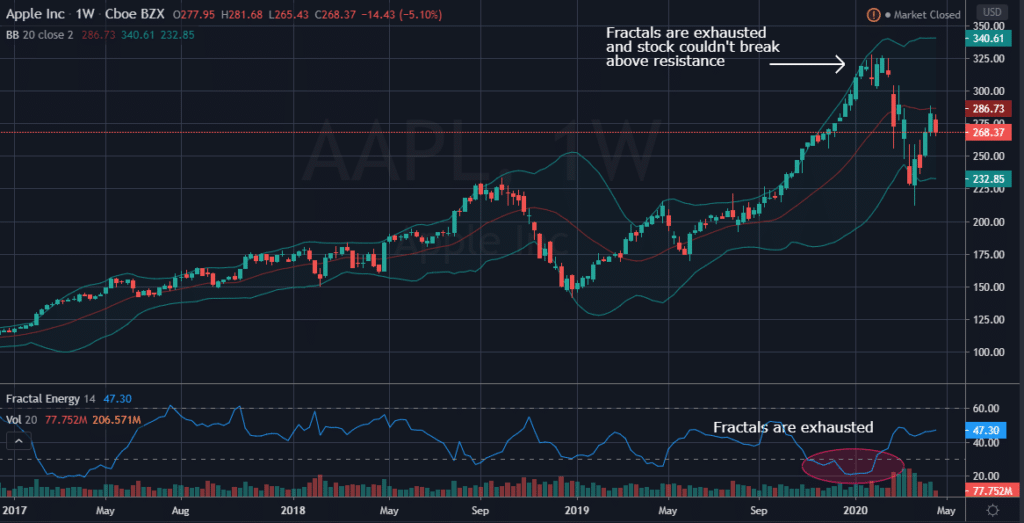
AAPL:
You can see in AAPL that once the Fractal Energy started to show signs of exhaustion, the stock started to find a top and roll over and head lower.
Source: Tradingview
Now… Let’s take a look at Bollinger Bands and how they work with Fractal Energy to find trades.
Next…
Bollinger Bands
Bollinger Bands were developed by John Bollinger as a price envelope designed to define the upper and lower price range levels of a stock.
Bollinger Band Indicator consists of a middle Simple Moving Average (SMA) along with an upper and lower offset band. Because the distance between the bands is based on statistics, such as a standard deviation, they adjust to volatility swings in the underlying price.
How do you read them?
Bollinger Bands help to determine whether prices are high or low on a relative basis, and according to these calculations, price should fall within range 95% of the time!
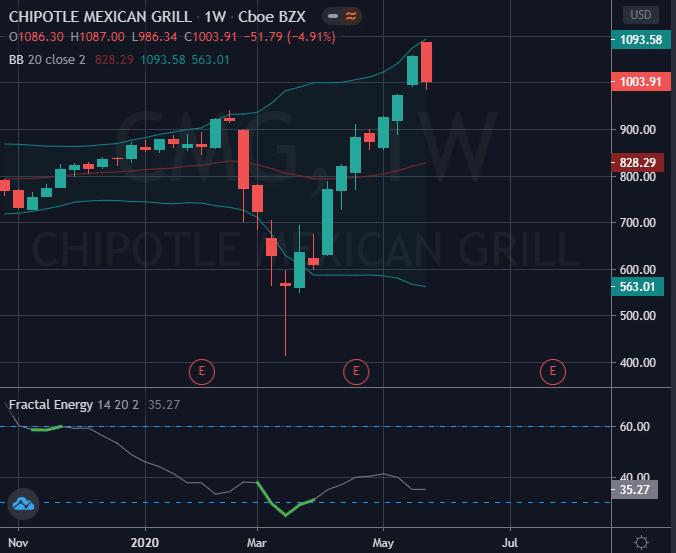
Let’s take a look at an example chart in CMG that happened in the middle of the CoronaVirus market collapse.
How I reviewed CMG’s chart when I wanted to go long this stock.
With CMG there were multiple price action signals being given to us all around the same level.
The buy signals:
- Price was extremely sold off, extending far into the lower Bollinger Bands
- Fractals were showing total exhaustion readings under 35
- There was major buying power coming into the stock as it traded down to almost $400/share
Source: Tradingview
How this indicator works:
- When Bollinger Bands tighten, there is a high likelihood that price will have a sharp move
- When the bands separate by an unusually large amount, this is showing a significant increase in volatility or a gap in stock price.
- The stock price can exceed and even hug or ride the band price for extended periods of time.
- Price has the tendency to bounce within the bands’ envelope, touching one band and moving back towards the other.
- You can use the middle SMA or opposite band as target prices and exits for your trading
- If prices move outside of the band, it’s expected to see a trend continuation until the price moves back inside the band.
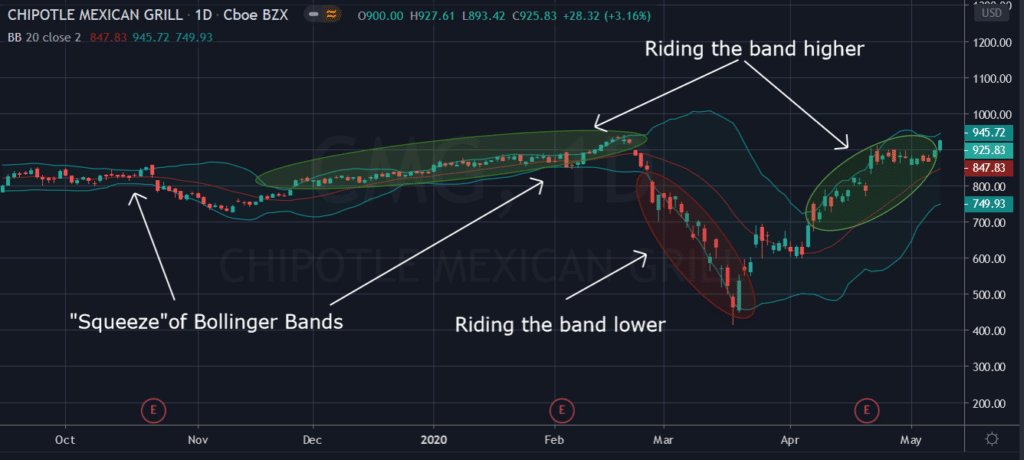
Let’s take a look at this chart closer…
Source: Tradingview
Here you can easily see exactly the many signals the Bollinger Band will give a trader from the items that were listed above.
In a quick glance the trader will see :
- Tightening of bands leads to breakout
- Stock trends higher, riding upper band
- Trader can buy the moving average the entire way up
- Price drops suddenly below lower band and snaps back inside the next day acting as a price barrier
As you can see, Fractals and Bollinger Bands have the ability to pinpoint market reversals and then you just need to trade the correct strategy to take advantage of this edge.
And I always turn to a credit trading strategy in order to take full advantage of these huge market swings.
Putting It All Together
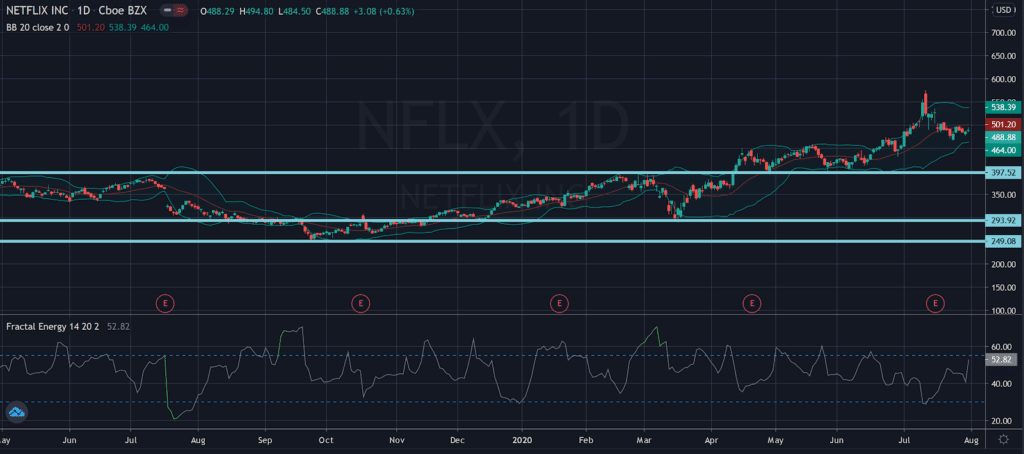
Recently I alerted to a trade I took in NFLX:
Options Profit Planner Trade Alert: I sold the Nov ’20 $290/280 put spread for $1.25
I found this trade by noticing the put spread was trading at a credit of over $1.00, and were below their 52-week lows, with 2 huge levels of support above this price.
In addition to the horizontal support levels, the Bollinger Bands were also suggesting that there was support right below the price.
And combined with the Fractal Energy, It’s showing to be exhausted and most likely not able to continue lower without a bit of a sideways action to occur first.
Let’s see what the chart looked like.
Source: Tradingview
And the strategy that I used to capture this move is called a Put Credit Spread.
When creating these strategies, I make sure of 2 things:
- The net credit is greater than $1 (sometimes not possible)
- The net credit spread is near 50% away from the current market price
- The strikes are at or near the 52 week lows on the stock
Let’s see what I came up with on this trade.
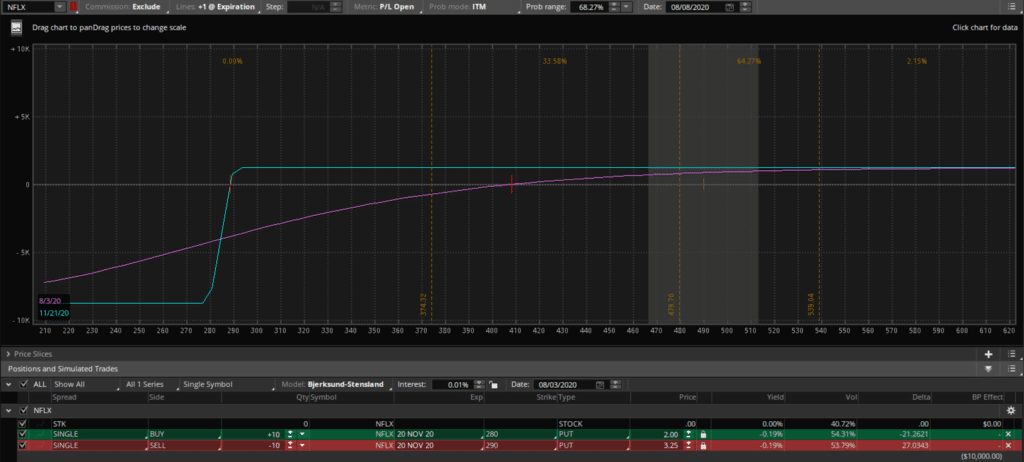
Source: Thinkorswim
As you can see I have met my requirements from above.
- My Net Credit is over $1 minimum requirement at $1.25
- The credit spread is nearly 50% away from the current market price
- Strikes are at or near the 52-week low
Wrapping up
When looking at these two strategies combined, this really is where statistics and trading probability really shine and make for a highly profitable trading opportunity.
Not only do I trade using an indicator that tells me 95% of the time price will stay inside a range, I also combine it with an options strategy that can pay me 100% ROI on my trade if timed correctly to the markets.
So… to recap what makes this trade a really high probability winner.
- The Options sellers always have statistical advantages over buyers. That’s a built-in feature for the entire options market, regardless of calls or puts.
- Trading credit spreads can pay me 100% returns, which cannot be done when buying calls or even the stock outright.
- Lastly, combining a proven indicator into my trading system that when signals a stock is oversold both statistically and on the charts. Remember, there is a 95% chance it will head higher and not lower.
Ready to take action and get into trades like NFLX where you could possibly return 75%-100% ROI?
0 Comments