When traders panic and volatility shoots up…
That’s where I shine.
It’s not because I love trading stocks to the short side…
Not at all…
It has to do with a phenomenon that occurs in the options market…
And it’s the reason why I’ve been able to profit by 90% over the last three months…
Options Profit Planner
The Fractal Energy Indicator is a measure of the internal energy of a stock and signals to the trader the likelihood of trend or chop in the near term.
The power of fractals allows me to determine the strength of trends and how much “life” is remaining in a stock’s movement.
There are 2 main components of Fractal Energy:
- Markets Fractal Pattern
- Fractals are found throughout everything in nature, from plants to shorelines… and even the financial markets!
- The Internal Energy
- Energy is the term used to describe the stored or potential energy of a stock. Potential energy is like a spring that is compressed, that is ready to erupt when you release the force that is keeping it held together.
So by combining those two different components, you create a single indicator, Fractal Energy Indicator, that is able to successfully determine the strength or weakness of a trend on any stock.
Now that we covered what Fractals are, let’s take a closer look at what the Fractal Indicator is and how it can accurately signal a major pivot in the markets.
Fractal Energy Indicator
The Fractal Energy Indicator is a momentum indicator that measures the internal energy of a stock.
The 3 main zones are :
- Charging
- Charged
- Released/Trending
And unlike other indicators, the Fractal Energy Indicator is able to give the trader a deep look into what the stock is wanting to do.
As you know, trading off any indicator by itself without others is a set up for failure, and the same goes for the Fractal Energy Indicator.
So let’s take a look at how to combine the Fractal Energy Indicator with the Bollinger Bands to give the best odds of a successful trade.
Bollinger Bands
Bollinger Bands indicator consists of a middle SMA combined with an upper and lower offset band to give the envelope the stock should stay inside, like the ropes of a boxing ring.
And because the distance between the bands is based on statistics, such as a standard deviation, they adjust to volatility swings in the underlying price.
Now how do you read these?
Bollinger Bands help to determine whether prices are high or low on a relative basis, and according to these calculations, price should fall within range 95% of the time!
Let’s take a look at an example chart on AAL:
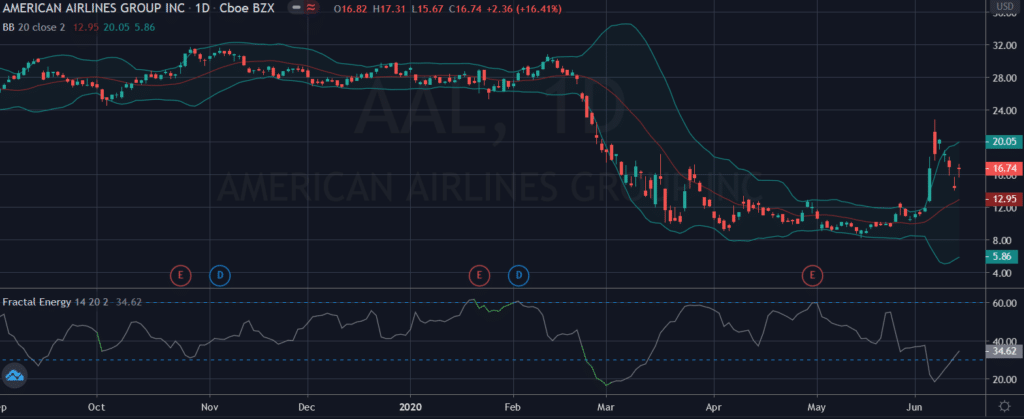
Source: Tradingview
One thing you can tell is that the stock’s price falls inside the Bollinger Band nearly every trading day. It is very infrequent where the stock trades outside of the bands, but when it does it snaps right back into the range.
Cheatsheet for the Bollinger Band :
- When Bollinger Bands tighten, there is a high likelihood that price will have a sharp move
- When the bands separate by an unusually large amount, this is showing a significant increase in volatility or a gap in stock price.
- Price can hug or ride Bollinger Band prices for extended periods of time.
- Price has the tendency to bounce within the bands’ envelope, touching one band and moving back towards the other.
- You can use the middle SMA or opposite band as target prices and exits for your trading
- If prices move outside of the band, it’s expected to see a trend continuation until the price moves back inside the band.
The Trade
So this is a unique trade in that it broke out into a four-part signal.
- A trade setup
- The trade signal
- Position management
- Exit
First…let’s take a look at how this trade set up and got on my radar.
Trade Setup
Let’s start off by taking a look at how the Fractal Energy indicator combined with Bollinger Bands is signaling when it’s safe to enter the markets again after the collapse.
Highlighted at the red box, the Fractal Energy is starting to enter a phase where the markets are getting charged up and ready to make a move again.
Then when you combine with the Bollinger Band, you can see that the markets are looking to trade higher. This can be seen by the stock being supported by the lower Bands.
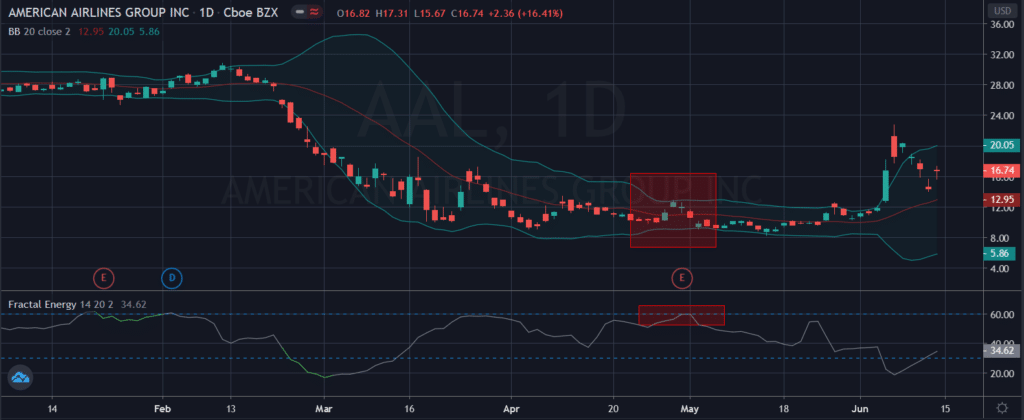
Source: Tradingview
The Trade
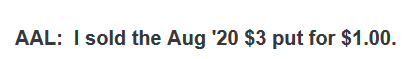
To start this trade, I sent an alert out signaling the long position I was taking by using the options strategy, Short Puts.
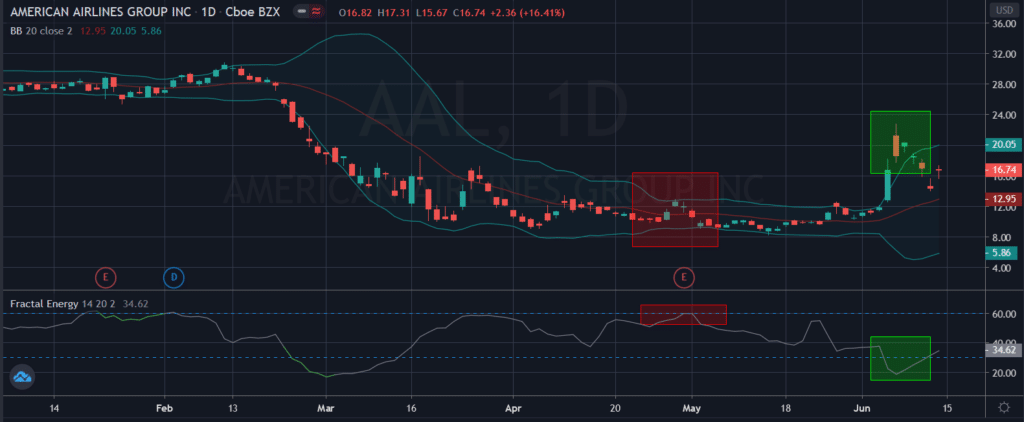
Source: Tradingview
And then as the stock took off and started to release its Fractal Energy, I was looking for my exit price.
Which is exactly what the Fractal Energy Indicator showed as well.
Once the stock became depleted I knew it was time to start to look for an exit price.
So by using the Bollinger Bands combined with Fractals, I knew it was time to buy the trade back.
Wrapping up
Traders, the markets have staged one of the most ferocious rallies anyone has seen.
Recently, it has shown a little sideways to slightly negative price action that has caught many off guard.
But by using the tricks of Bollinger Band and Fractal Energy – you could have stayed on the right side of the markets when they signaled exactly when this was going to happen…
Plus with the right strategy, you can still return over 90% returns when others are struggling to make heads or tails of what’s happening.
Click here to sign up to Options Profit Planner today
0 Comments