This market is on fire.
It’s filled with crazy opportunities if you know where to look.
But you need to get in before the herd comes rushing in.
Of course, this is hard for a lot of traders to be good at.
Most new traders usually ask:
- What chart patterns are worth looking at?
- Are fundamentals important?
- What indicators should I use?
- Are earnings names good to trade?
Now, it’s great that new traders are asking those questions – that means they are wanting to learn!
Unfortunately, not all indicators are created equally.
And I believe that there are two concepts traders should be focused on…
Momentum and Location
For me personally, those two factors help me spot a trade that’s about to pop off.
Now, let me show you how they help me time my trades better.
Timing The Markets
Momentum and Location in the markets are everything, in my opinion.
And the way I time the markets is by knowing where the momentum is going to come in…
Which means it’s important to know both where the buyers are and when the buyers are coming in
You see, this is the When, Why, and How of an explosive stock movement all wrapped up into one location.
However, timing is one of the hardest things to do in the markets. And sometimes everything could align but the buyers just simply cannot overtake the sellers.
But, I feel that I’ve actually developed a strategy that pinpoints when I should get into a specific stock, where I should lock in gains, and how I will take a loss if it doesn’t work out.
This is one of my trading strategies, specifically designed for capturing market momentum every week…

You see, I believe Fractals are what moves stock prices. Now, chart patterns may work, but what actually causes these chart patterns?
Buyers and sellers, in my opinion…
When buyers and sellers are fighting for stock price, certain patterns will form.
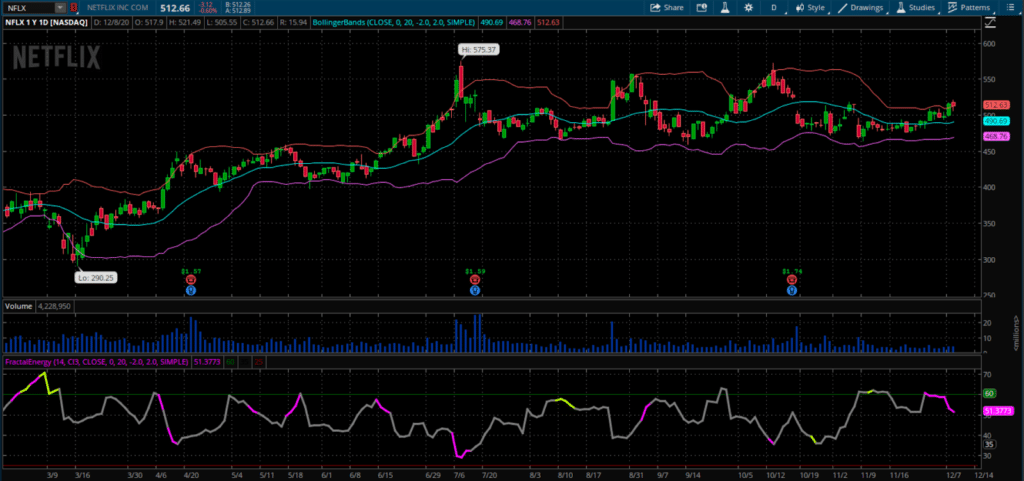
And when the buying and selling is taking place at elevated levels, I typically see Fractal Energy continue to climb.
It will continue to climb until it releases its energy when either the buyers or sellers take control of the stock.

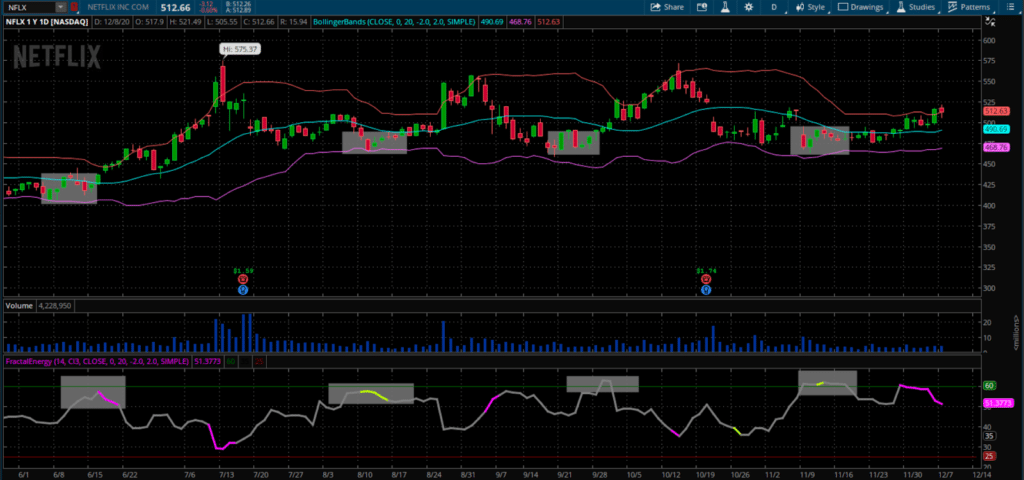
Let’s take a look at these 4 locations where Fractal Energy was fully charged and the markets were at a support level.
What happened?
The stock traded higher shortly after signaling the Fractal Energy was fully charged for this specific chart.
How did I know this?
And I knew the direction based on the Bollinger Bands, or a technical indicator that tells me where the support is located for a stock.
The key is to spot where a fully charged Fractal Energy lines up with the Bollinger Bands.
Now, most traders try to chase stocks higher or trade 100 different indicators… but not me.
To be honest with you, that’s too difficult to analyze and break apart the information that the indicators tell me.
For me personally, I just want to follow the K.I.S.S Rule, (Keep It Simple, Stupid).
And now that I’ve found the location where the stock is going to trade higher… I now move to finding my trade.
This is where I turn to trading credit spreads instead of buying stock.

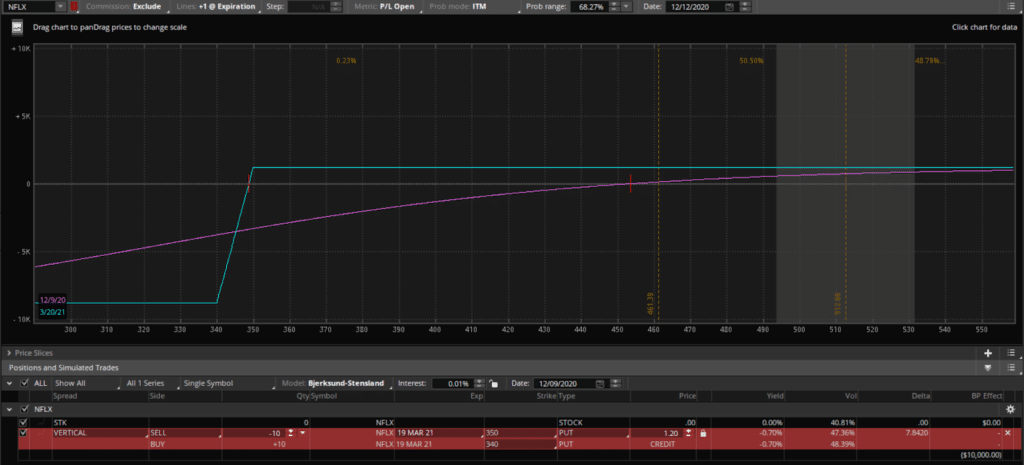
You see, when I sold the 19 Mar ‘21 340/350 @ $1.20… based on my Fractals and Bollinger Bands, it was a signal the market wouldn’t go much lower. However, keep in mind, markets move fast, and things change.
So I sold these options to traders who were trying to short NFLX.
Now, I am looking to cover this position and start getting out of my trade.
You see, I laid out my buy level, my target level, and my stops clearly to enter this trade.
And this way I am calm, cool, and confident with my trade and don’t let any emotions get in my way to make bad decisions.
I can come up with trade ideas on my own, but I prefer to let the market come to me and tell me where and when I should be trading.

0 Comments