Last week the markets were screaming lower, causing deep gashes in the daily charts stemming back to 2017.
And based off this morning’s sell-off, this volatility isn’t going anywhere yet.
If you’re an options trader this is a fantastic opportunity to make money.
And one of the most lucrative and little-known trading strategies is volatility selling.
When trading “short vol” it can allow traders take advantage of high levels of implied volatility and make money without having to trade stocks.
What makes this trading strategy desirable is that a trader can take advantage of the “buy low, sell high” or “sell high, buy low” in the options markets and not have to worry about what the underlying stock is going to be doing.
So next…let’s take a look at implied volatility and how it affects everything we do with options on a daily basis.
I’m going to teach you how it all works and how you can stack handsome profits through this approach.
Implied Volatility
Implied Volatility, or (IV) is one of the most important concepts for options traders to understand for many reasons.
Two reasons why IV is important:
- First, it shows how volatile the markets may be in the future.
- Second, implied volatility can help you calculate profitabilities and probabilities.
This is crucial with understanding IV which can be the deciding factor between an option that is profitable and one that is not.
Note: Implied volatility may alert a trader to market uncertainty and large movements, it does not alert the trader to direction of the movement.
So even though IV is one of the most important pieces of information an option trader needs to monitor, the IV is found by using an option pricing model, therefore meaning that this data is theoretical. This means that there is no guarantee that these forecasts will be accurate, but more of a “best guess”.
If a trader can understand IV, then they will be able to enter into simple or very complex options trades and take advantage of the market’s uncertainty and mispricing.
For example, many traders make the mistake of thinking they are going short the markets by purchasing a put option. As this might be generally true, a long put option in actuality is a long volatility trade, not a short stock trade due to the nature of Delta and IV on the option price.
One strategy many traders take advantage of is how IV is pricing the options. By referencing IV, a trader can use this to find bargains or over-inflated values, assuming that the IV is too low or too high on that stock.
This interpretation does have one limiting factor associated with it. This limitation is that implied volatilities impact on an options price is the cause of recent market activity. However, this is all relative as “cheap options” and just become more “cheap”, and “expensive options” and just become more “expensive”.
Let’s take a look at ways to avoid this common mistake and get an accurate view of implied volatility on the options pricing.
Historical vs Implied Volatility
There are two primary types of volatility a trader will reference at any point in time.
Those two types of volatility are:
- Historical Volatility
- Implied Volatility
Historical volatility is the annualized standard deviation of past stock price movements that measure the daily price change in the stock over the past year.
Implied volatility is derived from the option’s pricing models and shows what the market implied about the stock’s volatility in the future. IV is one of six inputs used in an options pricing model, but it is the only one that is not directly observable in the markets. Implied volatility therefore acts as a critical statistical reference for option value, meaning that the higher the IV, the higher the option premium, and the lower the IV, the lower the option premium.
Note: In the real-world, pricing the options via mathematical model is good, but not perfect. When the markets act irrationally, fear or greed drive option prices at which people would buy their stock for. In other words, order flow drives option prices.
Using Implied Volatility To Trade
Implied volatility shows the market’s viewpoint of the stocks future movement, but fails to forecast a direction. If the implied volatility is high, the markets are pricing in the potential for large price swings in either direction of the stock. Alternatively, if the implied volatility is low, the markets are pricing the potential for small price swings in either direction of the stock.
So how do we turn IV into a tradable opportunity?
Well, IV offers a mathematical edge to test, forecast, and identify entry and exit points of a stock’s trades without having to use a stock chart. When IV’s are calculated, you will end up with an expected range from high to low values, giving you an idea of what to expect IV to fall in between for the next year of trading.
There are two main ways to trade IV and they are:
- IV Ranking
- IV vs HV
IV Ranking
IV Ranking is a concept that allows traders to relatively analyze implied volatility to a standardized value. Implied volatility is a factor in the determination of the option pricing and attempts to measure future volatility. IV ranks take that measurement and averages it so there is a context around what the current level of implied volatility we are dealing with.
Why is this important?
Well, stocks with high implied volatility have more premium, (which is negative for option buyers and positive for option sellers) compared to stocks with a lower iv rank.
Therefore, option sellers like it when implied volatility is high because they can collect a higher premium for their trade. On the other hand, option buyers like it when implied volatility is low because they can buy the options at a discount or cheaply.
How is IVR calculated?
IVR = 100 x (the current IV level – the 52 week IV low) / (the 52 week IV high – 52 week IV low)
Using IV as an Indicator
Another way to use IV is as an indicator on a chart in ToS.
This plotted value tells you the implied volatility of a stock over the course of the time period, and can give you a visual representation of what is cheap vs expensive.
Here is an example of this plotted on AAPL.
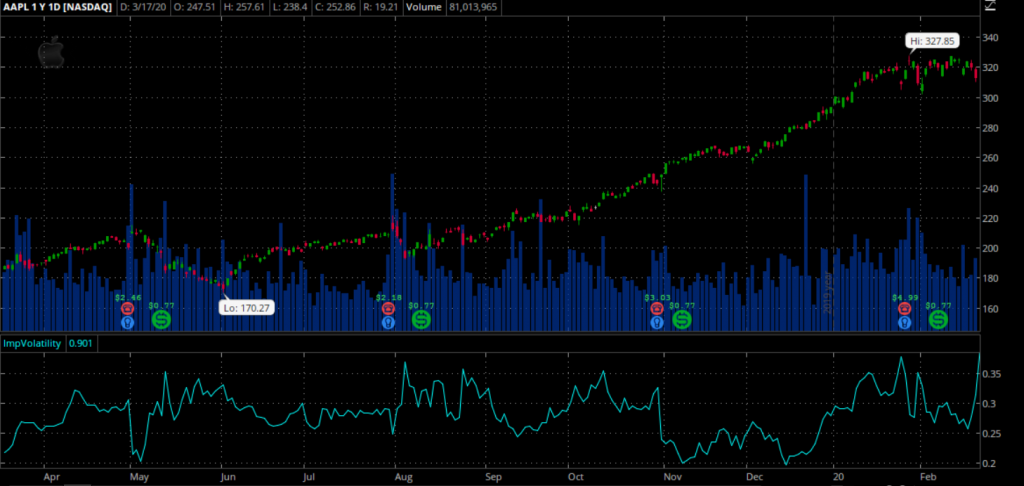
Source: Thinkorswim
As you can quickly see, there is a natural range to the highs and lows, acting as barriers that the IV will bounce inside.
Then as IV reaches the upper band of 0.35, you would be able to sell options to go short volatility, and as IV approaches the lower bands, you could buy options and make money in the other direction.
What stands out:
- Spikes in IV align with larger bar movement of the underlying stock.
- IV Ranking is range bound and lets you quickly identify overbought/oversold zones.
Because each stock has a unique implied volatility range, these values are not to be compared on another stock’s volatility.
Using Implied Volatility to Design a Strategy
When looking at implied volatility it’s important to design your strategy around the viewpoint you are trying to capitalize on. If you don’t have your trading strategy and viewpoints aligned you run the risk of creating a trading strategy that cannot capitalize on a single market event since it’s trying to do “too much.”
Four Things To Consider
- Make sure you can determine whether IV is high or low prior to getting into a trend reversal trade. Remember, as IV increases, options prices are becoming higher.
- If you come across periods of high volatility, it is most likely caused by some external force. It’s best to check for reasons that may be causing IV to be elevated, such as, mergers, earnings, or other announcements.
- When you see options trading with high implied volatility levels, it’s best to target option selling strategies. As options premiums are elevated, it’s best to avoid purchasing options and it might be more desirable to sell. Some strategies are covered calls, nake puts, short straddles and other various credit spreads.
- When you see options trading with lower Implied Volatility levels, it’s best to target option buying strategies. As options premiums are suppressed, it’s best to purchase options instead of selling options. Some strategies are buying calls, buying puts, buying long straddles, and other various debit spreads.
One way to trade Implied Volatility is through a strategy called Mean Reversion. Let’s take a look at that closer.
A Quick Note About Mean Reversion
Implied volatility has a mean-reverting tendency – meaning there are periods when it moves away from its historical average and then reverts back to the average.
A reversion to the mean involves retracing any price back to a previous average. In options it is thought that as price strays far enough away from its longer-term norm it will revert back to an average value.
Let’s take a look at a chart of AAPL:
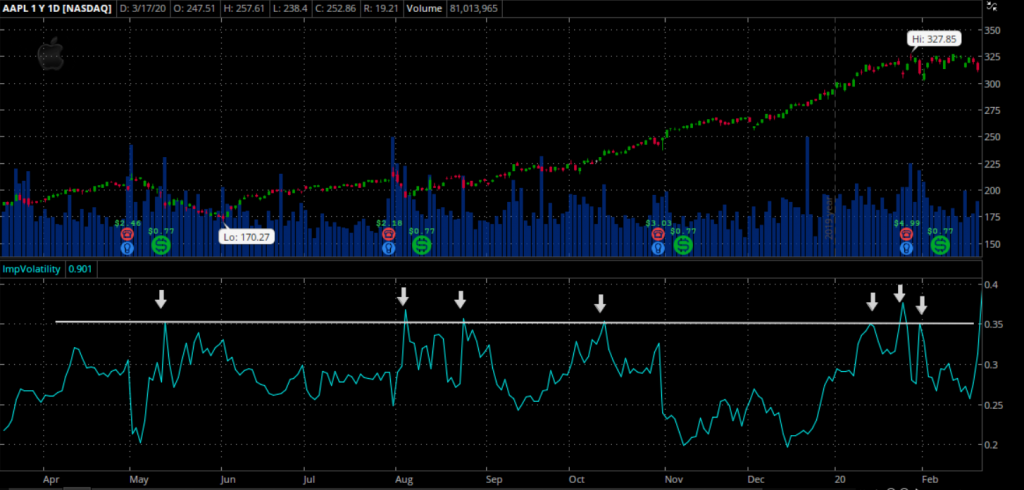
Source: Thinkorswim
Notice that at every white arrow the markets were selloff causing implied volatility to be elevated.
And shortly after, the markets continued in a sideways pattern allowing IV to decrease back to its acceptable level. This sudden decrease is exactly what option sellers are looking to take advantage of.
Another way to determine low vs high IV levels is to use a built in statistics tool found in Think Or Swim. (Make sure to check with your respective brokerage for their IV statistics)
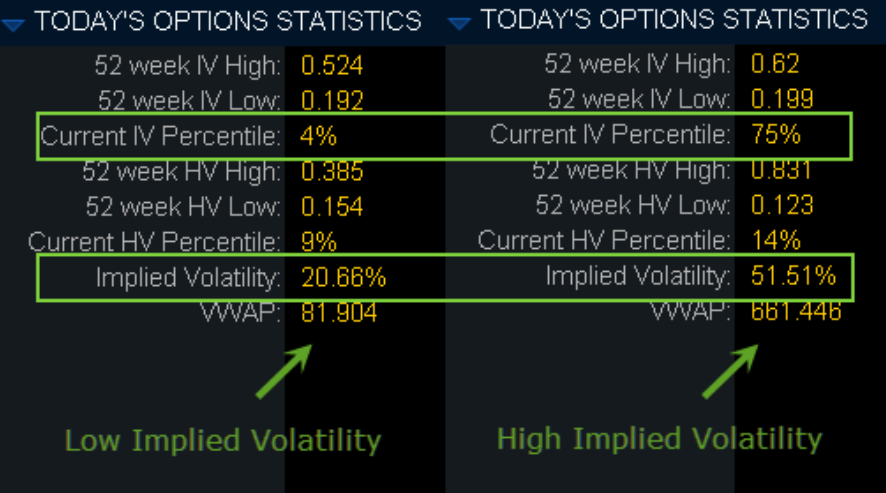
As a general rule, some traders will sell credit spreads when IV is between 67% and 100% percentile of its 52-week range.
Key points:
- Mean reversion suggests asset prices and historical returns revert to long term average levels
- Mean reversion has led to many investment strategies in options trading
- Mean reversion tries to capitalize on extreme changes in the price of a security, assuming it will revert to a previous price.
Wrapping up
There are many reasons an option’s implied volatility may deviate from its averages.
Some examples include upcoming earnings announcements, fed announcements or an upcoming merger and acquisition.
The key is to recognize when implied volatility is high compared to its historical highs. When it appears to be extended compared to past values, options traders should structure a trade accordingly.
The process of selecting option strategies, an expiration month and strike price, things can start to get complicated very fast.
But one factor you never want to overlook is Implied Volatility on that stock.
It is wise to always gauge the impact of what IV has on selecting your strategies.
There are a few things to remember about Implied Volatility:
- Bearish markets increase volatility
- Bullish markets decrease volatility
- Implied Volatility is a proxy for emotions of the underlying market and can be erratic
- It’s possible to align the underlying stock direction to the IV level to combine stock movement with shorting IV
- Implied volatility trading comes with built in entry and exit prices for your trade.
Want to learn about how I use options to profit in this market. Check out this upcoming presentation I’m putting together.
It’s all about a special indicator I call Fractal Energy and its incredible predictive powers. You don’t want to miss this!
0 Comments