Did you know that timing the markets is one of the hardest feats in all of trading…
In fact, you’re putting yourself in a world of hurt if trying to rely on it—to build long-term wealth.
However, attempting to accurately pick market tops and bottoms is what every trader strives to be a pro at.
And even though it may sound like a winning strategy…
It’s actually not… and comes at a huge price.
That’s because in order to pick two points that are such extremes…
You leave a trail of bad trades.
Why put yourself through that type of pain…
When there is something better.
Fractal Energy
The power of Fractal Energy allows me to determine the strength of trends and how much “life” is remaining in a stock’s movement.
There are 2 main components of Fractal Energy:
- Markets Fractal Pattern
- The Internal Energy
And by combining those two different components you create a single indicator that is able to successfully determine the strength or weakness of a trend on any stock.
Fractals tap into the inner strength of every stock across every time frame giving you the most comprehensive understanding of what a stock is going to do in the future.
Let’s take a look at some examples of how Fractal Energy picks the bottoms and tops of the stocks.
Next…
Fractal Energy – The Trade
Let’s take a look at how Fractal Energy was able to successfully predict the sideways action in AMZN.
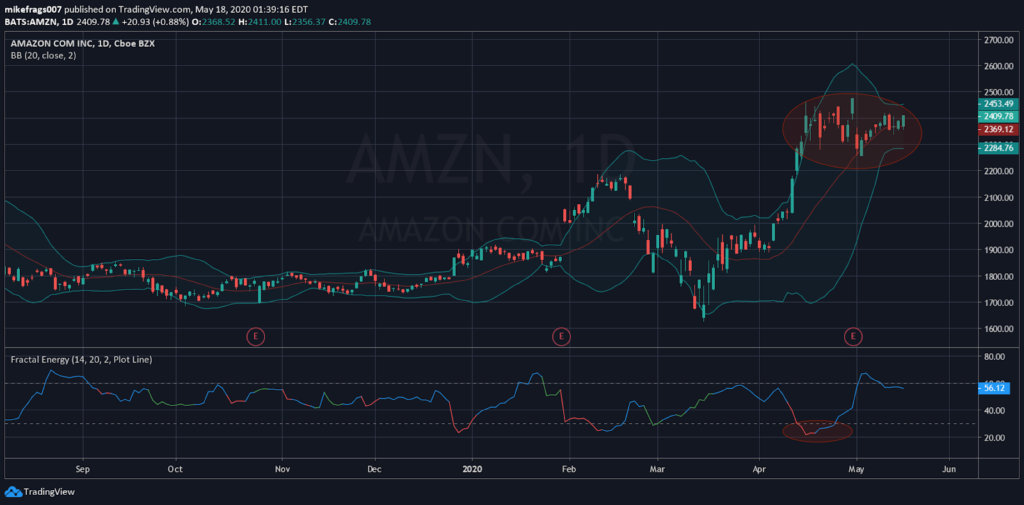
Source: Thinkrswim
What Fractals said about AMZN :
- The Fractal Energy indicator dropped to new lows, breaking below the lower threshold value of 30.
- Markets struggled to continue trend higher, and traded above the Bollinger Band upper resistance levels indicating severe weakness in the stock.
Fractal Energy – Trend Reversal Long / Market Bottoms
Now that we know Fractals can pick market tops and get you into trades that can generate you generational wealth, let’s see how it picks market bottoms.
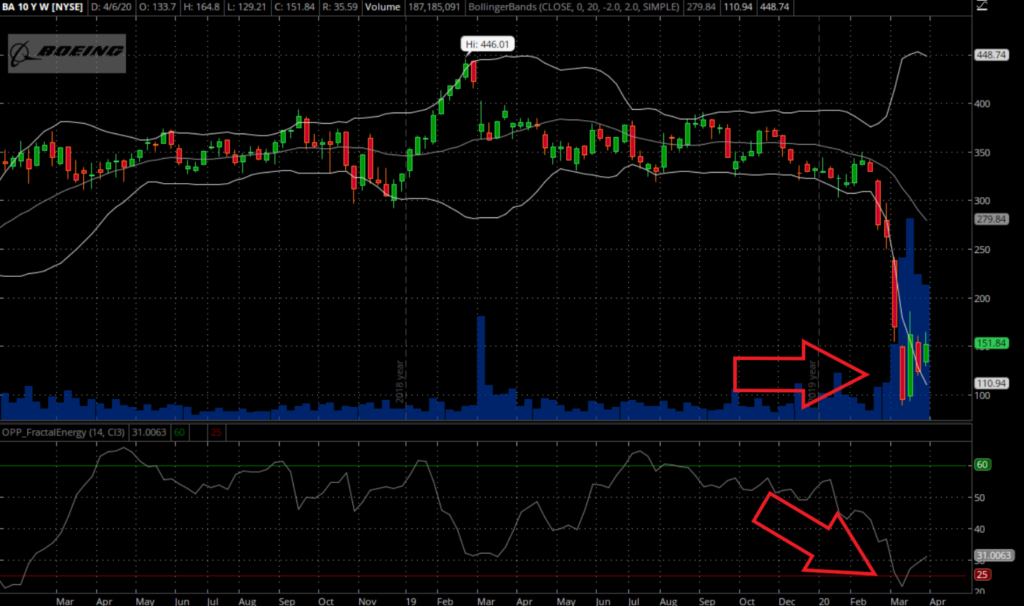
Source: Thinkorswim
This indicator is extremely versatile and it can be used for picking tops and bottoms!
Here is what Fractal Energy says on Boeing:
- Stock oversold, below Bollinger Bands
- Indicator reading at lowest volume since 2018
- If fractal energy continues to builds up the stock it is primed to explode higher
This trade has the Fractal Energy Indicator plummeting below the lower reading showing the trend is exhausted and is ready to reverse.
Additionally, the stock has significantly fallen in the last few months and has traded far outside the Bollinger Bands.
A Possible Trade
So let’s take a look at how we can take a Credit Call Spread and trade AMZN short.
First, let’s take a look at the chart pattern and see if it is something we can work with.
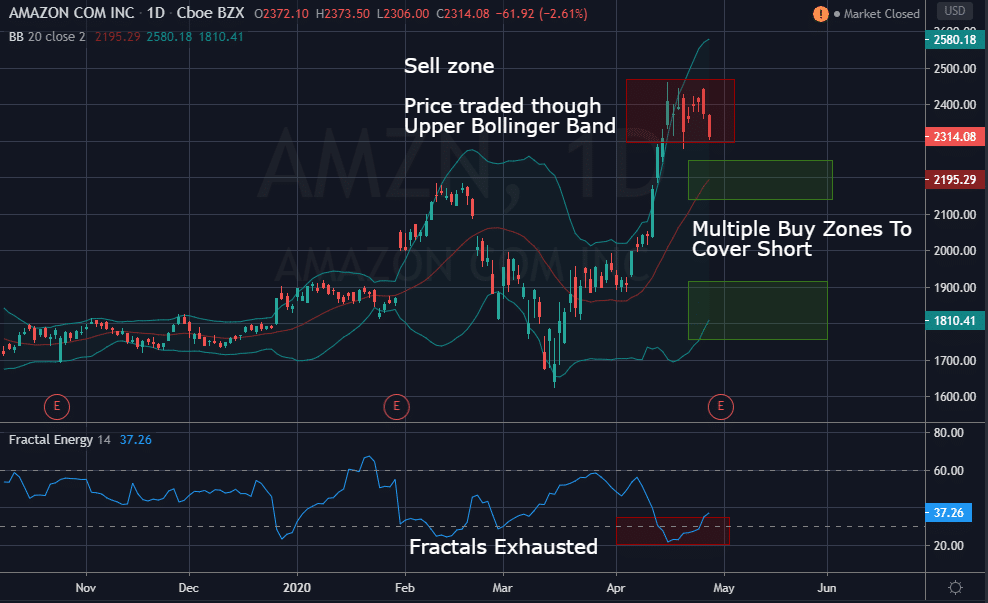
Source: Trading view
The projected outlook:
AMZN has a low fractal energy reading as it’s piercing the upper Bollinger Bands. This is signaling that the stock is exhausted in its move and is needing to either trade sideways or drop lower in order to regain its energy for higher prices.
Now, as we looked at earlier, you have 3 trades that you can place.
3 Trades are:
- Short stock
- Short call option
- Short call spread
And the only one that makes sense to trade is the short call spread to keep trading capital safe in the event the stock was to gap higher on us. (Truth be told, this is highly unlikely to the upside in a large name such as Amazon.)
Now, if we were that confident that the stock would fall, why not just sell the underlying security in the first place?
Wrapping up
A fractal is a never-ending pattern and is repeatable and found across everything in nature, such as coastlines, pine cones, and snowflakes.
Another interesting fact about Fractals is that they are infinitely complex patterns that are self-similar across different scales.
They are created by repeating a simple process over and over in an ongoing loop. Meaning that a pattern working on a weekly time frame will work all the way down to a tick time frame.
When searching for ways to tap into the inner workings of the stock market, I knew right away that I had to have the power of Fractals as part of my strategy and they would do the job, perfectly.
Are you searching for that edge and to find stocks that are setting up for tops and bottoms to trade the ererals..
If so,
0 Comments