Most trading brokerage platforms offer clients an array of charting options and technical analysis tools to choose from.
And to be honest, if you’re new to the game, they can be darn right overwhelming.
RSI…MACD…Awesome Oscillator… there is seemingly unlimited number of choices
fyi…yes, that’s a real indicator.
Which is why I want to share the Options Profit Planner system with you.
I believe it will help teach you how simple it is to trade the markets without the need for numerous indicators.
This unique system combines the power of Fractal Energy and Bollinger Bands to give both strength of trend and support and resistance information for every trade.
Now let me show you the power of these two indicators combined with a credit trading strategy.
And how I combine them to give me an edge against the pros.
Options Profit Planner
Options Profit Planner is a system that is designed around key technical analysis and indicators that allow me to find an edge in the markets.
Once I find my trades, I then put the odds of the casinos to work for me by selling options and leveraging credit spreads.
Now sometimes I bite off more than I can chew but that’s ok! It’s important to make sure you have a back up plan, for a back up plan, for the main plan.
But trading smartly is what keeps me in the game.
And if I need to end up owning the stock, I am ok with that! Since I only trade stock I feel comfortable investing in to start with.
The Indicators
Options Profit Planner is focused around technical analysis and indicators to give me an edge against the pros.
The two indicators I use are Fractal Energy and Bollinger Bands to find stocks.
Let’s take a look at what these two indicators are…
Fractal Energy
Fractal Energy is the cornerstone indicator of Options Profit Planner and its power is used to pinpoint key market reversals.
The power of fractals allows me to determine the strength of trends and how much “life” is remaining in a stock’s movement.
There are 2 main components of Fractal Energy:
- Fractal Pattern
- Energy
And when you use the power of this indicator you will be able to successfully determine the strength or weakness of trends on any stock.
Let’s take a look at how Fractal Energy accurately predicted the market selloff
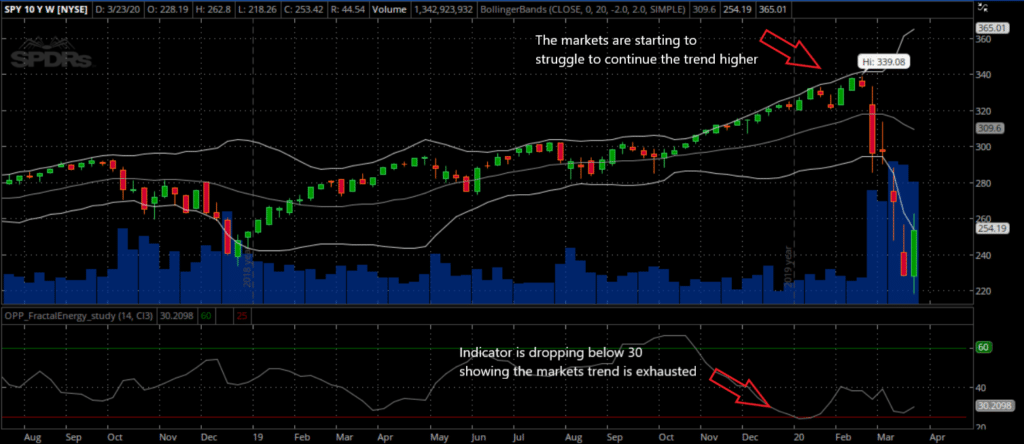
Source: Thinkorswim
Here is how this breaks down…
Breaking down what Fractals said about the markets at all time highs:
- The Fractal Energy indicator dropped to new lows, below the lower threshold value of 30
- Markets struggled to continue trend higher, showing weakness in the stock
Once the Fractal Energy became exhausted and the markets couldn’t get above the upper Bollinger Bands, the SPY plummeted lower.
Bollinger Bands
Bollinger Bands were developed by John Bollinger as a price envelope designed to define the upper and lower price range levels of a stock.
For anyone who is unfamiliar with Bollinger Bands here is some background information to learn how this indicator can help you time the markets with superior accuracy.
Bollinger Band Indicator consists of a middle SMA along with an upper and lower offset band. And because the distance between the bands is based on statistics, such as a standard deviation, they adjust to volatility swings in the underlying price.
How do you read them?
Bollinger Bands help to determine whether prices are high or low on a relative basis, and according to these calculations, price should fall within range 95% of the time!
Let’s take a look at an example on TWTR
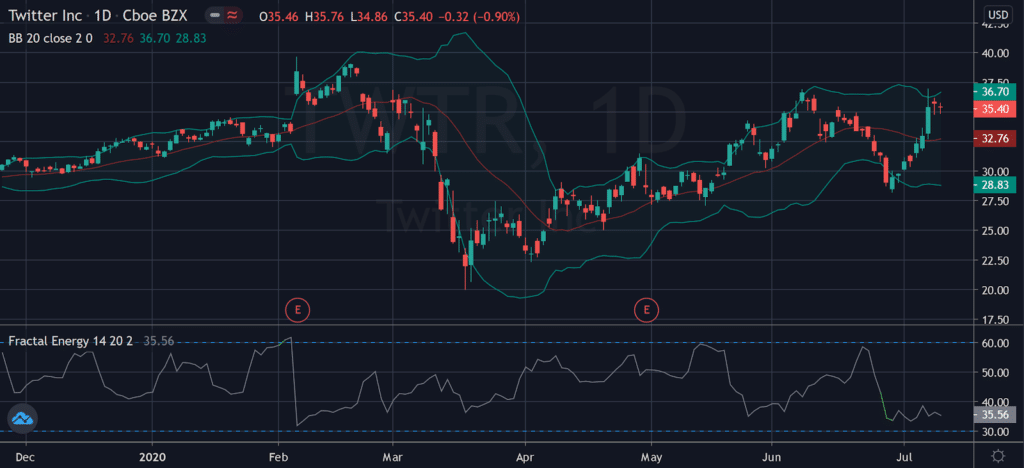
Source: Tradingview
You might notice right away that price tends to fall inside the Bollinger Band nearly every single trading day.
And if the price did trade outside of the bands, the stock made sure to rebound quickly to get back inside of it.
How this indicator works:
- When Bollinger Bands tighten, there is a high likelihood that price will have a sharp move
- When the bands separate by an unusually large amount, this is showing a significant increase in volatility or a gap in stock price.
- Price can exceed and even hug or ride a bands prices for extended periods of time.
- Price has the tendency to bounce within the bands’ envelope, touching one band and moving back towards the other.
- You can use the middle SMA or opposite band as target prices and exits for your trading
- If prices move outside of the band, it’s expected to see a trend continuation until the price moves back inside the band.
Let’s take a look at the SPY’s chart
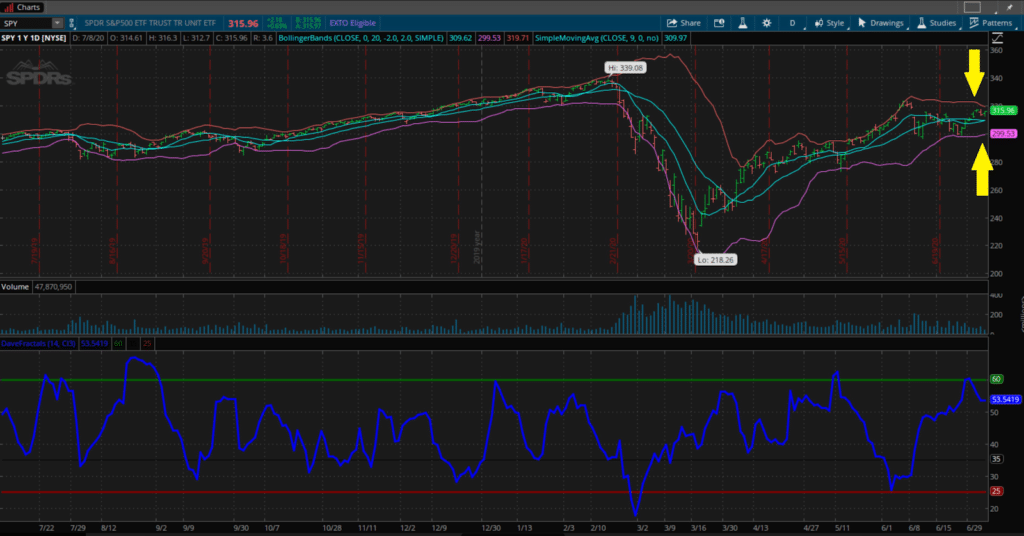
Source: Thinkorswim
A review of what you will find in Bollinger Bands:
- Tightening of bands leads to breakout
- Stock trends higher, riding upper band
- Trader can buy the moving average the entire way up
- Price drops suddenly below lower band and snaps back inside the next day acting as a price barrier
Wrapping Up
When trading with Fractal Energy and Bollinger Bands, a trader can find market reversals that can put them in a position to generate significant income from selling puts or credit spreads.
By selling puts or a credit spread, the trader will make full profits by the options expiring with little or value.
Additionally, the put seller will be able own the stock at their desired levels and turn this position into an investment.
And once they own the stock, the trader will be able to ride the price higher after the selloff is over.
And that’s why Fractal Energy is the cornerstone indicator of Options Profit Planner!
0 Comments