This has been quite the week so far, to say the least… and it all started with a circuit breaker being triggered on Monday’s open as the futures were down over 7% heading into the open.
But we have finally gotten through it and we are on the other side. And still in one piece.
So where do we go from here?
Well, it’s tough to say but at quick glance, it appears we might see the light at the end of the tunnel.
And as I have been saying over the last few days… this selloff is turning out to be a great opportunity to finally get long the markets at a great price.
To determine exactly where I am looking for entries I rely on one of my favorite indicators, the Bollinger Bands, to inform me of when prices are going to make a move higher.
The Basics
Bollinger Bands were developed by John Bollinger as a price envelope designed to define the upper and lower price range levels of a stock.
For anyone who is unfamiliar with Bollinger Bands here is some background information to learn how this indicator can help you time the markets with superior accuracy.
Bollinger Band Indicator consist of a middle SMA along with an upper and lower offset band. Because the distance between the bands is based on statistics, such as a standard deviation, they adjust to volatility swings in the underlying price.
How do you read them?
Bollinger Bands help to determine whether prices are high or low on a relative basis, and according to these calculations, price should fall within range 95% of the time!
Let’s take a look at an example chart.
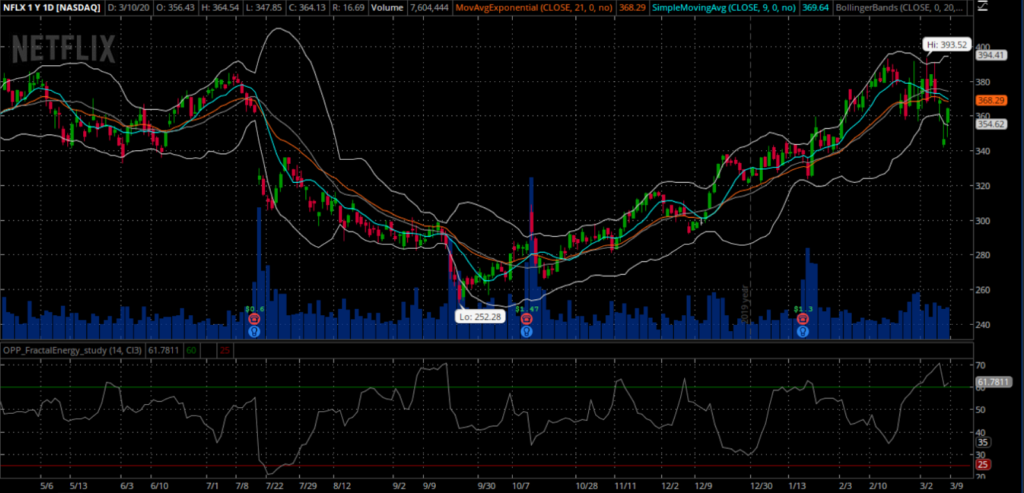
Source: Thinkorswim
You have notice right away that price tends to fall inside the Bollinger Band nearly every single trading day.
And if the price did trade outside of the bands, the stock made sure to rebound quickly to get back inside of it.
How this indicator works:
- When Bollinger Bands tighten, there is a high likelihood that price will have a sharp move
- When the bands separate by an unusually large amount, this is showing a significant increase in volatility or a gap in stock price.
- Price can exceed and even hug or ride a bands prices for extended periods of time.
- Price has the tendency to bounce within the bands’ envelope, touching one band and moving back towards the other.
- You can use the middle SMA or opposite band as target prices and exits for your trading
- If prices move outside of the band, it’s expected to see a trend continuation until the price moves back inside the band.
Let’s take a look at this chart closer…
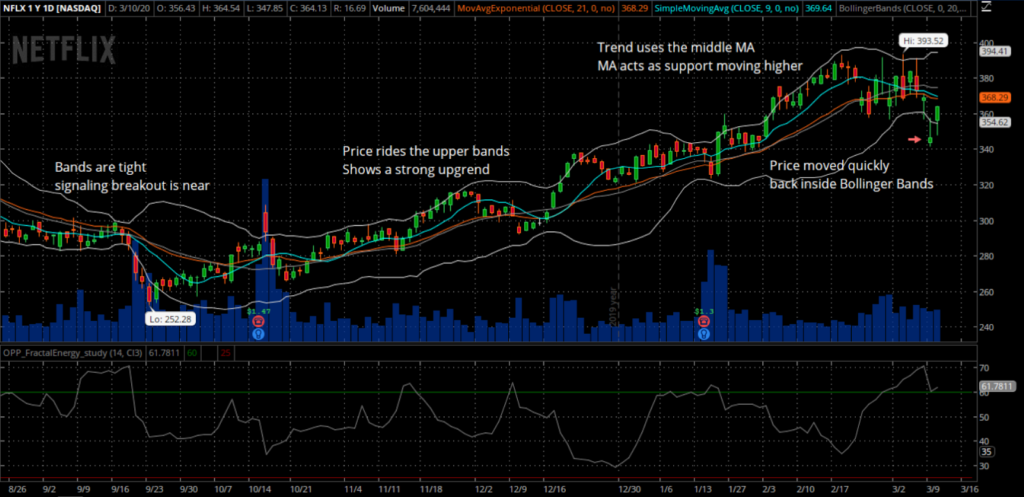
Source: Thinkorswim
Here you can easily see exactly the many signals the Bollinger Band will give a trader from the items that were listed above.
In a quick glance the trader will see :
- Tightening of bands leads to a breakout
- Stock trends higher, riding upper band
- Trader can buy the moving average the entire way up
- Price drops suddenly below lower band and snaps back inside the next day acting as a price barrier
So how does this work for trading?
It’s quite simple to apply this logic towards a trading strategy, like a Credit Put Spread system.
Finding The Trade
Let’s take a look at the same chart on Netflix and review what stood out to me.
The trade setup:
- I saw price fall below the Bollinger Bands when the market closed.
- There was a bullish inverted hammer that formed underneath the bands
- There was a lot of market volume going into the close and throughout the entire day
- The Fractal Energy indicator signaled it was charged up and ready to move
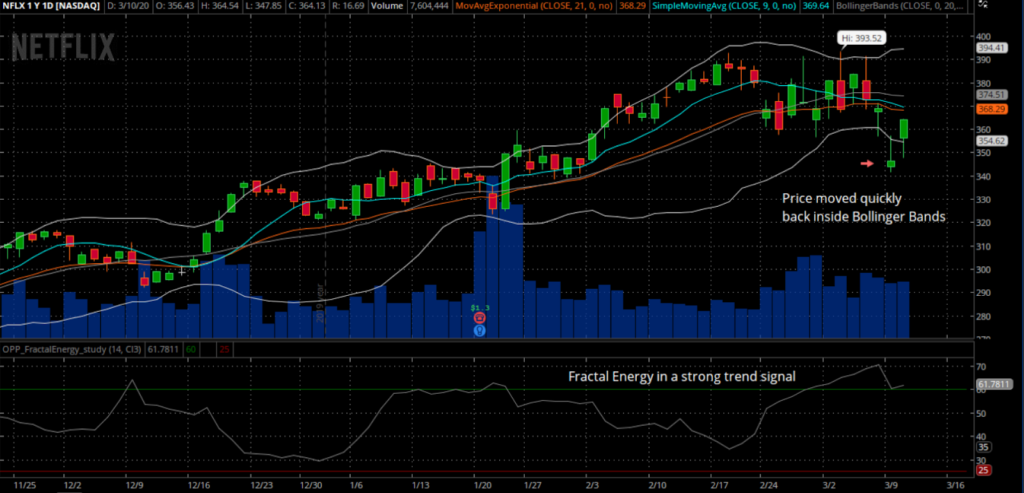
Source: Thinkorswim
My direction of the market is easy for me to understand after analyzing what was set up in NFLX…
And how would I have traded this position?
I would have been looking to sell Credit Put Spreads below the lows of the last pivot level.
So…Why sell credit put spreads instead of buying stock?
It’s actually quite simple…
As a stock slowly grinds higher, I don’t want to buy the underlying stock as it ties up too much capital and I don’t get paid for my risk. The same reasoning applies to buying call options as well, there is just no upfront payment to take this trade.
Now with selling puts, I am able to still participate in a bullish trade and get paid to do so!
A put credit spread involves selling one put option at a strike below the current price and buying a put option at a lower strike price. Both options will have the same expiration.
When you trade this strategy you will receive a credit upfront for taking this position. The maximum profits you can make on this trade is the credit you received when the stock trades above the upper strike at expiration. The maximum loss on this trade is calculated by the distance between strikes minus the credit received.
Here is a sample trade that could have been taken…
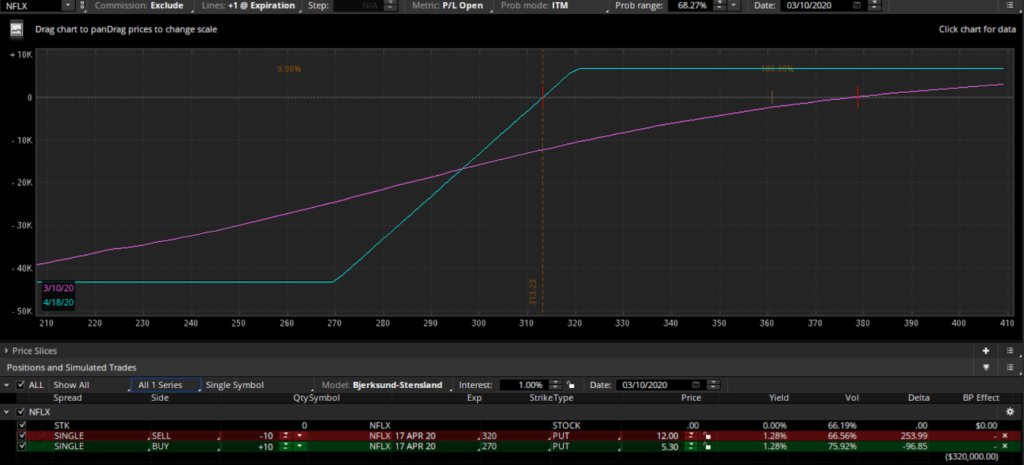
Source: Thinkorswim
Trade details:
- Sell NFLX 320 PUT
- Buy NFLX 270 PUT
- Total Credit $6.70
- Total RIsk $43.00
Now, this might seem like a big loss but it is really not compared to buying stock directly.
For example, if you were to buy the equivalent amount of stock, here are two outcomes to compare the profit and risk levels.
For the comparison let’s assume that we bought stock at current market price of $360
Trade comparison:
- If stock moves to $365, profits are $6700
- Total risk if stock goes to $270, around $43,000
- Total profit if stock moves to $365 is approximately $4000 in equity
- Total risk if stock goes to $270, around $92k
And that’s why selling credit put spreads instead of buying the underlying stock is far more lucrative to the trader. Not only do they return more money to the upside, they can do it on less risk to the downside when compared to owning the stock.
Putting it all together
I know this market is crazy… and even overwhelming to many. But you have to trust the tools that everyone uses to trade safely.
And two of those tools are the Bollinger Bands and the Credit Put Spread. When they are combined, they really are one of the best strategies a trader can deploy in markets that are unpredictable.
When looking at these two strategies combined, this really is where statistics and probability really shine and make for a highly profitable trading opportunity.
Not only do I trade using an indicator that tells me 95% of the time price will stay inside a range, I also combine it with an options strategy that can pay me 100% ROI on my trade if timed correctly to the markets.
So… to recap what makes this trade a really high probability winner.
- The Options sellers always have statistical advantages over buyers. That’s a built-in feature for the entire options market, regardless of calls or puts.
- Trading credit spreads can pay me 100% returns, which cannot be done when buying calls or even the stock outright.
- Lastly, combining a proven indicator into my trading system that when signals a stock is oversold both statistically and on the charts. Remember, there is a 95% chance it will head higher and not lower.
Click here to learn how I use the Bollinger Bands weekly to determine the market direction
0 Comments