Here are three catalysts I’m watching:
- Over 180 S&P 500 stocks report Q3 earnings, including FAANG stocks FB, AMZN, AAPL, and Google.
- The third quarter GDP, economists expect it to bounce back sharply with over a 30% growth rate
- Political rhetoric pertaining to the next round of stimulus and upcoming elections.
While many traders will sit out and stay on the sidelines, or chase momentum during earnings announcements…
I prefer to remain patient and let stocks shake out, then attack when the perfect opportunity presents itself.
That means I’ll be on the hunt for fractal energy trading opportunities
This week, I’ve uncovered some of my favorite patterns in three stocks — I want to show you what my indicators signal, and where these names can run to.
Why I’ve Got My Eye On These Three Stocks
When it comes to hunting down fractal energy trades, I look at the fractal energy scanner for ideas
I typically look for a specific pattern that involves fractal energy being fully charged and trading at or near key support levels.
Take a look at the list of stocks the screener has reported for the week ahead of possible fractal energy setups to trade
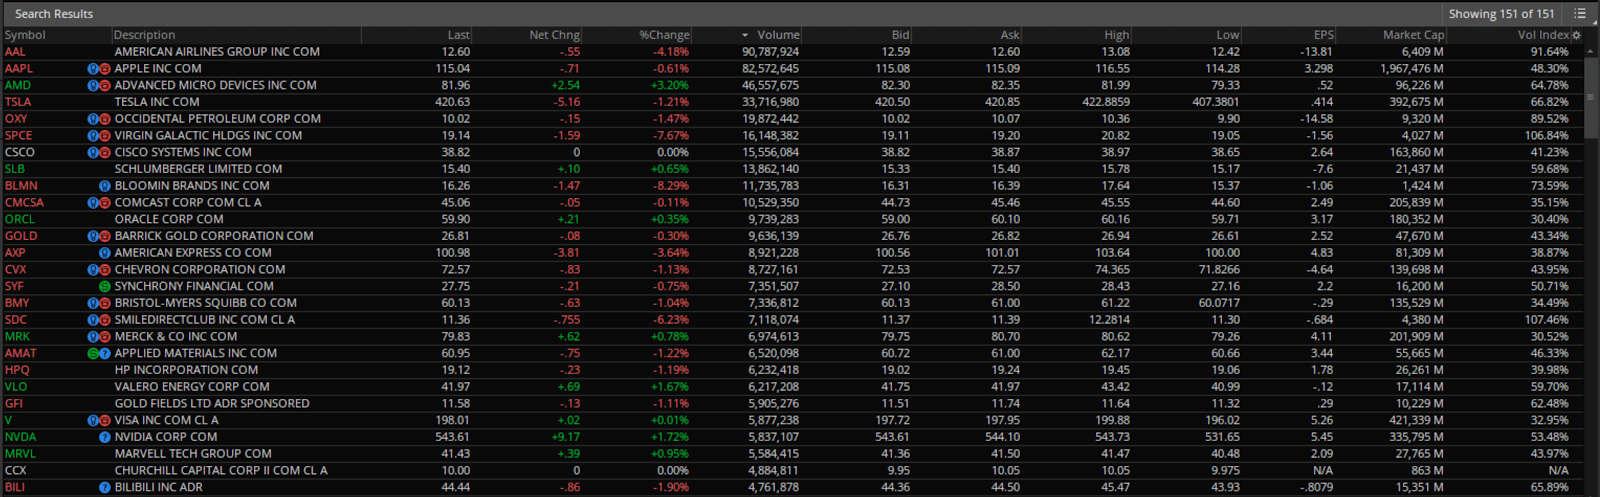
Now I don’t want to take every one of them, but instead get together a list of the “best of the best” to trade on
Momentum might continue this week, but in my opinion, it’s best to stay patient and wait for the stock to trade into your levels. So I will create a watchlist of the trades I want to keep a closer eye on or even place trades in.
Strategy Corner : [Not sure how to trade credit spreads? Click here to learn more now!]
Tesla Inc Com (TSLA)
Starting off the watchlist is a stock that I recently traded for slick profits.
Members of Energy Trader were able to learn and watch this trade pan out…
Another win in the books to keep the undefeated streak alive! *
But even though I just exited this trade, that doesn’t mean I’ll move on and find another stock.
You see, there are no emotions in trading – only fractal energy and support levels!
And it’s the combination of fractal energy and support levels that is telling me that TSLA could be ready to make a breakout at any moment.
Let’s take a look at a stock chart of TSLA
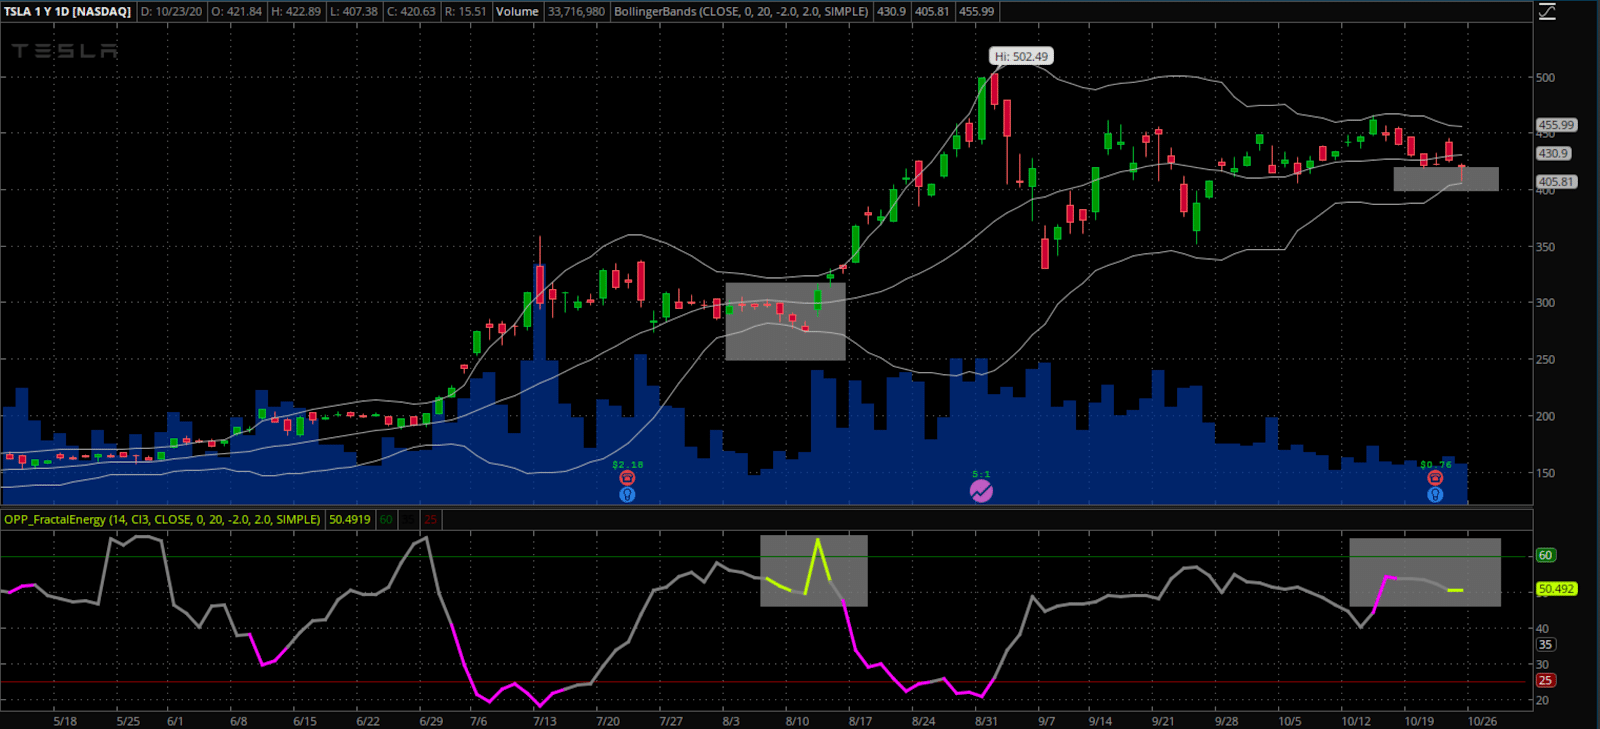
Now, if the stock continues to hold this support level and fractals remain charged, I might be looking to trade this stock higher.
Also, the $400, $350, $325 pivots are all places for the stock to bounce and they may be support levels if the stock trades lower. If TSLA finds support, then I think the stock could trade towards all time highs again and possibly take them out.
On the flip side, if TSLA starts to consolidate here, the Bollinger Bands and support levels can keep the stock in a tight sideways action, allowing the Fractal Energy to continue charging.
Even though TSLA is setting up as a perfect trade, it’s still missing one key part to signal a buy to me.
So it’s important to remain patient and see what this stock does next week.
Since it’s already after earnings, it could be a perfect trade – so I’ve got it on my radar!
Apple Inc Com (AAPL)
Next up, Apple Inc. (AAPL).
Once the new iPhone craze settles, we will start to get a better understanding of what to expect moving forward.
But so far, we know a few things are going on
- iPhone 12 preorders for have more than doubled those of iPhone 11, according to analysts
- Apple sold nearly 2 million units of the iPhone 12 in its first day of sales, compared to 500,000 for the iPhone 11
- Analysts expect iPhone 12 to be the biggest launch in years, resulting in a “supercycle” of upgrades from users of older devices
Now I’m not a fundamental trader, but this type of news is interesting to me when it comes to positioning around earnings.
Ultimately, price action is king, and it comes down to fractals and support levels for the final decision.
And what I’m noticing is that AAPL is setting up for a perfect setup to sell credit spreads on.
Let’s take a look at what I am noticing in the chart of AAPL
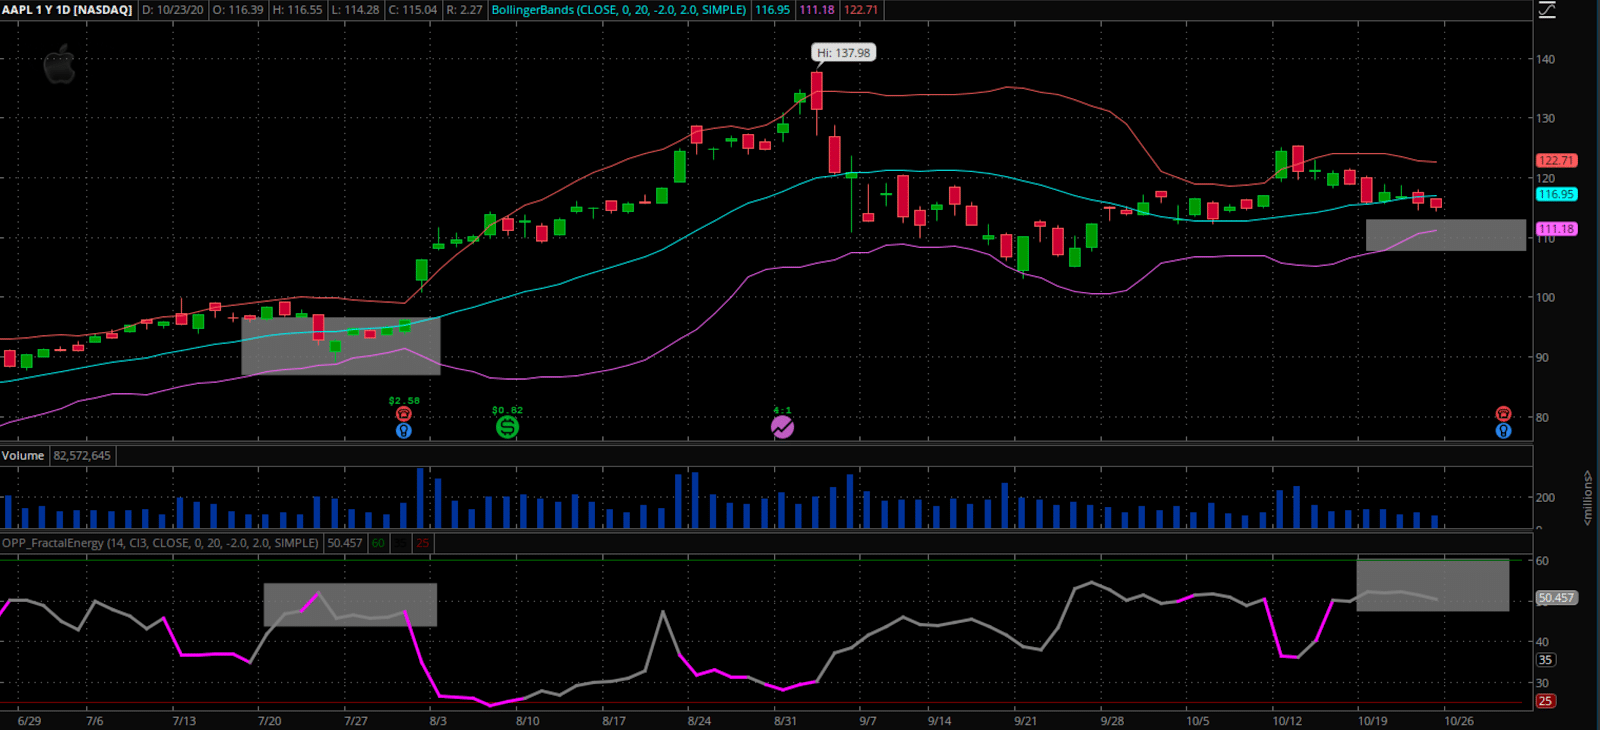
With AAPL, Bollinger Bands are actually going to be the key indicator to watch, since the Fractals appear to be stable and want to remain in a “charged state”.
In the past, Bollinger Bands have continued to provide support for AAPL and allow it to either sit at that price level or trade higher from there.
If the lower Bollinger Bands don’t hold, I’ll be looking back at past pivot levels for support. That means $105 and $100 could be in play and I’ve got my eye on a possible retracement down to those levels.
Plus, if we do get a slightly larger pullback in AAPL, it will allow the Fractals to continue to chart higher, resulting in even more energy for AAPL to trade on.
But of course, anything can happen with AAPL going into its earnings announcement. If the Fractals fade away or the stock has an unfavorable move due to earnings , I won’t be looking to take this trade anymore.
Advanced Micro Devices Inc Com (AMD)
Last up, there’s Advanced Micro Devices (AMD)
This stock is technically not part of the FAANG or social media tech companies, but it’s only one of two companies that actually POWERS the tech firms!
That’s right, this microprocessing firm is causing waves in the industry and pushing the boundaries of what can be done with computers used by those “big tech” firms.
Recently, AMD has dominated the computer processing industry, kicking Intel (INTC) to the curb in the last couple of years.
But again, fundamentals only paint half of the picture of how a stock trades.
Instead, I am going to turn my attention to my favorite technical analysis research to determine how I’m going to trade this stock
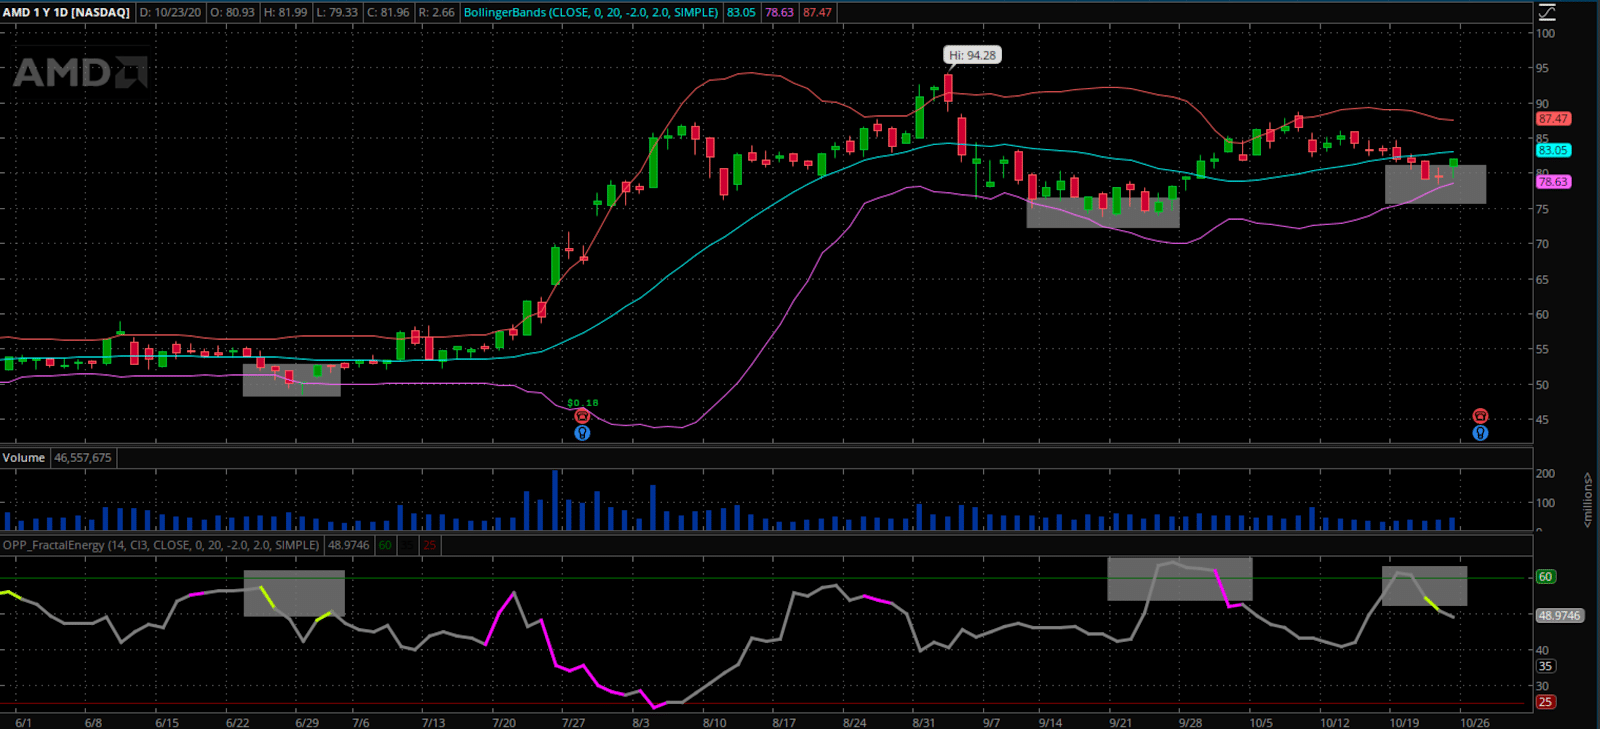
Since AMD has held the lower Bollinger Bands the last three out of three times since June, technically we should start to see higher prices out of this stock in the near future.
And it’s important to notice that Fractals were in a charged state during each of these Bollinger Band supports being touched.
But just in case things get a bit hectic around earnings, there are a couple support levels I want to keep an eye on. I would like to pay attention to $75, $70, and $65 if the stock sold off after earnings.
I want to see what the stock does here near the Bollinger Bands and if it starts to spend its energy.
If it manages to hold the Bollinger Band as it heads into earnings, the fractal energy should be able to propel the stock past highs, with a shot of breaking $100 for the first time in history.
Wrapping Up
There are plenty of Energy Trades out there, and I want to teach you how to find them.
That’s why I created Energy Trader, so you can learn how I identify my scalable and reliable pattern to attack the market.
Now, this is just my watchlist for the week ahead
And if my pattern sets up perfectly, I will be taking these trades.
But only my subscribers will receive exclusive access to this information.
To stay up to date with my weekly research and receive actionable trade alerts when I place my trades, sign up to my Energy Trader subscription today.
Remember, once I decide to trade these stocks I will not be sending this information out to anyone other than the subscribers of Energy Trader
So before missing your chance at learning how to trade one of these stocks utilizing my special indicators – sign up here before it’s too late.
0 Comments