There are thousands of indicators one has at their disposal…
From RSI to VWAP…momentum to mean reversion… there’s an unlimited number of combinations you could come up with.
Test them all out… and it will most likely drive you crazy.
So what’s the solution?
I designed a proprietary indicator that shows both trend and chop signals in an easy to read plot.
It’s called the Fractal Energy Indicator, and I use it before I enter every one of my trades.
Which is why I want to show you exactly how powerful it is to find your trade… no matter what type of trader you are.
Fractal Energy
Fractal Energy is the cornerstone indicator of Options Profit Planner and its power is used to pinpoint key market reversals.
The power of fractals allows me to determine the strength of trends and how much “life” is remaining in a stock’s movement.
There are 2 main components of Fractal Energy:
- Fractal Pattern
- Energy
And when you use the power of this indicator you will be able to successfully determine the strength or weakness of trends on any stock.
Energy is the term used to describe the stored or potential energy a stock has built up. Like a spring that is compressed, it stores potential energy and erupts when you release the force that is keeping it held together.
And by combining those two different components you create a single indicator that is able to successfully determine the strength or weakness of a trend on any stock.
Fractals tap into the inner strength of every stock across every time frame giving you the most comprehensive understanding of what a stock is going to do in the future
Now I typically use Fractal Energy on the daily timeframe but I want to quickly show the power of the indicator on higher time frames.
The Weekly Chart
By using Fractal Energy Indicator, Options Profit Planner has been able to predict this move down and this bounce almost perfectly!
And the way to predict larger market movements is to reference a longer time frame to understand what the major trends are doing.
Let’s take a look at SPY’s with the Fractal Energy plotted…
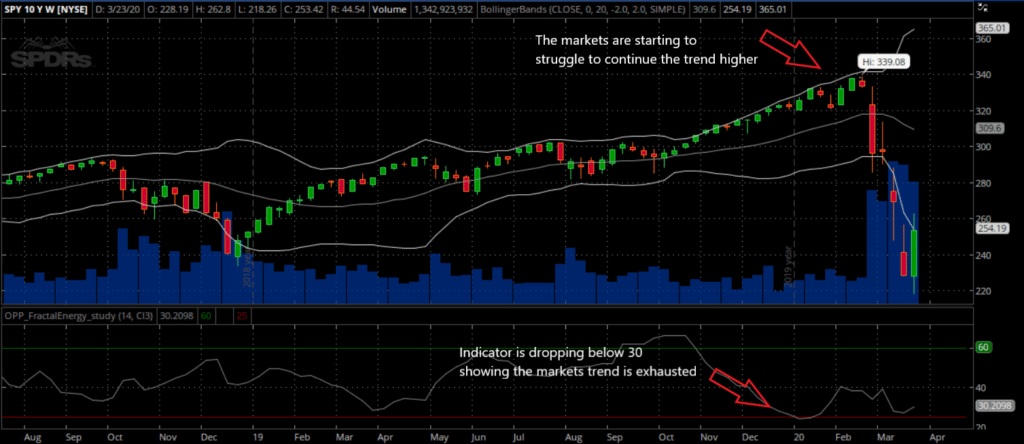
Source: Thinkorswim
Here is how this breaks down…
Breaking down what Fractals said about the markets at all-time highs:
- The Fractal Energy indicator dropped to new lows, below the lower threshold value of 30
- Markets struggled to continue trend higher, showing weakness in the stock
Ok so that might work, but perhaps that same signal was generated with an RSI.
And it’s true! There are times where other indicators might give the same signal.
I’m going to now show you how Fractal Energy stands out from the RSI.
Fractal Energy vs The Competition
When looking at a stock chart, many times a trader is just guessing at what levels to enter their trade at.
And to make it worse, there is hardly any information that a trader can reference just by looking at standard indicators.
When reading the RSI, when a value is near or over 70, a stock is considered to be overbought.
At this point, a trader would most likely remove shares of the stock they own at these levels, or execute a short trade.
And that’s exactly the opposite of what a trader should really be doing at certain key levels.
The RSI
Let’s take a closer look at a sample trade on TSLA with Overbought RSI readings.
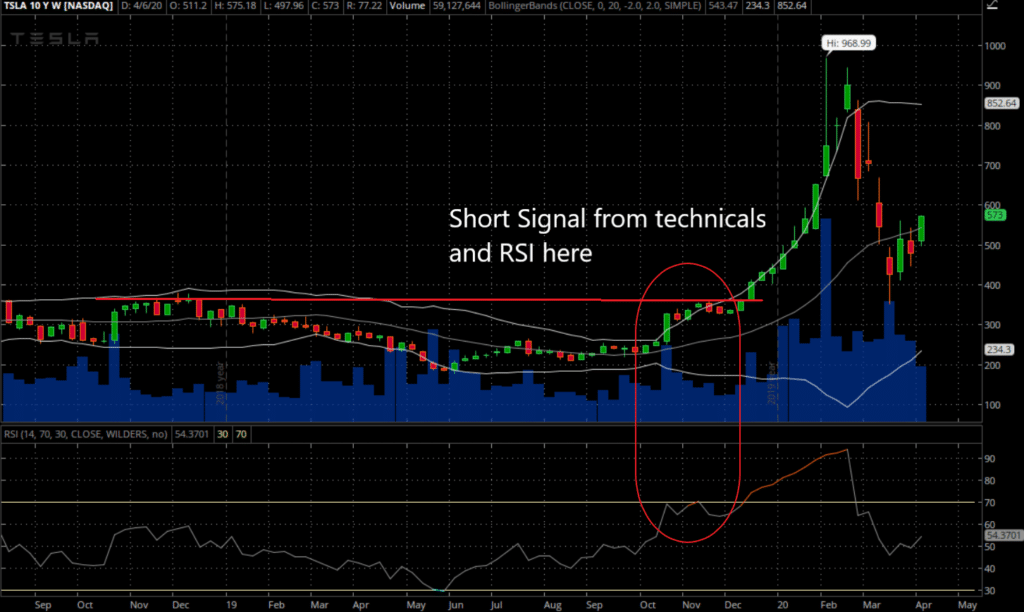
Source: Thinkorswim
According to traditional RSI strategies, if the value of the indicator was to reach overbought, the trader would look to short the stock.
And clearly looking at the chart this would have been a terrible spot to go short TSLA.
Why did this happen?
Because RSI is a simple calculation that measures the number of moves up and down to determine the ratio of up bars to down bars on a stock.
This ratio is inherently flawed as it doesn’t take into account any energy the stock might have built up going into the overbought zone.
The Fractal Energy Indicator
Now let’s take a look at how we would look to TSLA with a charged reading in the Fractal Energy Indicator.
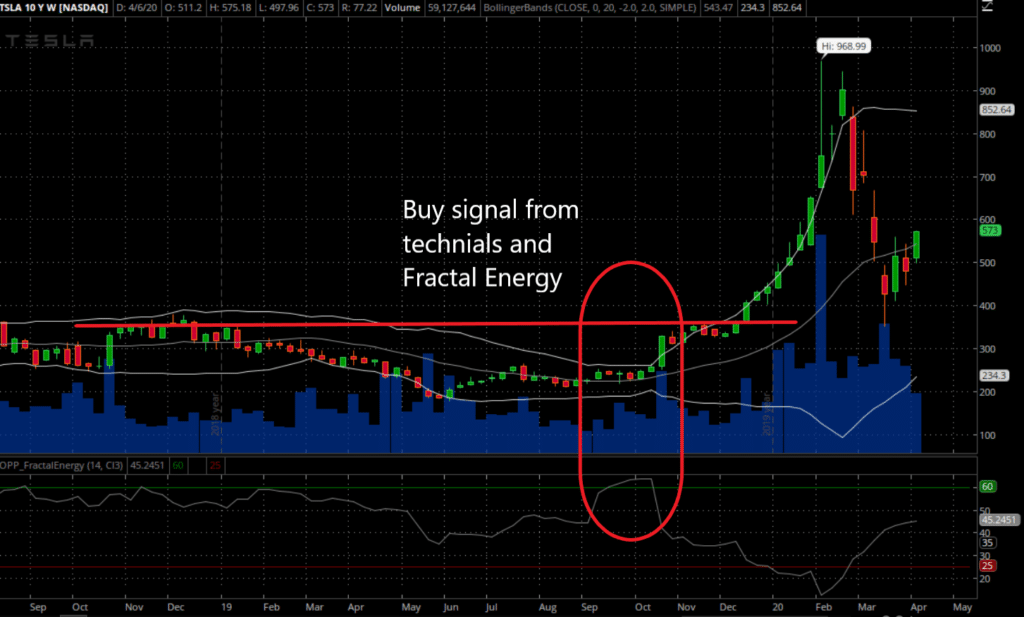
Source: Thinkorswim
According to the Fractal Energy Indicator, we would actually look to get long with a charged reading on the indicator!
And what a trade this would have been if you were able to get into it!
The Fractal Energy Indicator of TSLA at the time was the highest reading in a year! This means that the energy was more charged than usual, causing stock to erupt to the upside.
This setup sent the stock of TLSA soaring from $250/share to nearly $1000 in 6 months!
After the move, the Fractal Energy Indicator started showing the lowest reading all year, with a 12, showing the move is fully exhausted and can’t run any further.
Now that you see the difference, let’s go over how you can use credit spreads and short options to take advantage of the “casino effect”, or the ability to be the house with winning odds.
Selling Options and Credit Spreads
In order to get long or short the markets, a trader is left with only a handful of choices, and those are buying or selling stock or buying calls or puts.
And to be honest, buying options is usually a terrible idea.
Although there are times when you could be right on the direction and still lose on the trade because of other factors such as Implied Volatility decreasing the price of the stock on you.
One strategy you might not have heard of is a credit call spread, and that’s the trade we are going to focus on when looking to short the stock.
Definition: A credit spread, or net credit spread is an options strategy that involves a purchase of one option and a sale of another option in the same class and expiration but different strike prices. It is designed to make a profit when the spreads between the two options narrows.
Simply put – a credit spread strategy will make you money, while a debit spread strategy will cost you money.
This is the house vs the gambler.
And at Options Profit Planner, I want the house odds in my favor as the business owner and expect to have steady money coming in, not going out!
A credit spread involves selling a high-premium option while purchasing a low-premium option in the same stock and option type.
As a credit trader you have 4 strategies to generate income for your business.
The 4 trades to go long or short the markets are:
- Short Put
- Short Call
- Short Put Spread
- Short Call Spread
Wrapping up
A fractal is a never-ending pattern and is repeatable and found across everything in nature, such as, coast lines, pine cones, and snowflakes.
Fractals are created by repeating a simple process over and over in an ongoing loop.
Meaning that a pattern working on a weekly time frame will work all the way down to a 1 minute time frame.
Which is exactly why I want the Fractal Energy to work for me! And when I am selling options, I want to put the house odds in my favor!
And only then do you then have a winning combination that can give you the best shot at making money in the markets!
Now – start tapping into the inner workings of the stock market and make Fractal Energy a cornerstone of your trading business!
To get started, Click here to sign up for Options Profit Planner now!
0 Comments