Many times when traders first start out in the markets, they only buy options on stocks they are familiar with.
If you were to ask what stocks were traded, AAPL, TSLA, NFLX or any prime time news station stock would come up first.
And what has always boggled my mind is that people really believe that the news station stock pickers are out to help them!
There are MILLIONS of people watching these news stations, and by time you blink, the stock or option has already made its move!
And this is not a way to trade with an edge…
Instead, if you want to stand apart from the rest, you need a strategy that stands alone and has stood the test of time trading throughout one of the worst markets ever seen.*
And this strategy actually searches for stocks to trade and puts the odds of the casinos to work for you.
Options Profit Planner
Options Profit Planner is a revolutionary options trading strategy that is designed to search and locate trades and put the odds of the casino in your favor.
This is done by a proprietary trade searching algorithm that hunts down and locates trades to focus on and credit spread trading to achieve 70%+ odds of winning with the possibility of 100% returns on each trade.*
But what is this built on?
Well, this strategy is built around 3 main concepts: technical and fundamental research, credits spread strategies, and fractal energy.
Now… let’s look at how each of these will take your trading up a notch and improve the chances of landing consistent profits.
Fundamental Research
With thousands of stocks to trade each day, it’s easy to become overwhelmed with selecting what to actually put your money into.
But you won’t stand a chance against the other sharks of Wall St. if you just pick random stocks to buy…
So the first step I take is with by looking at my scanner in Finviz
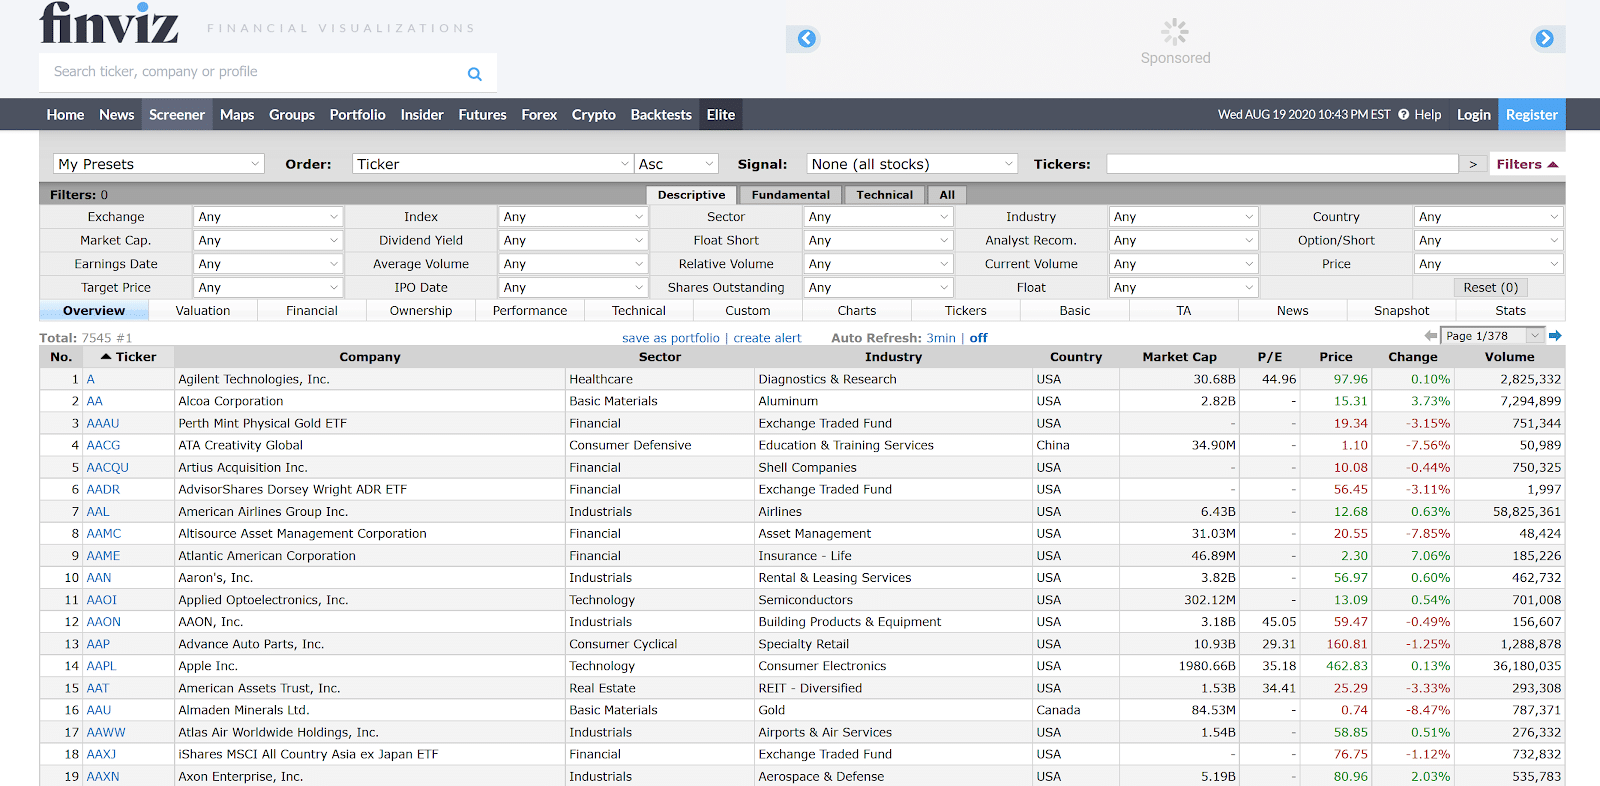
Source: Finviz.com
And this scanner is absolutely free for you to use so you don’t have to worry about any expensive subscriptions to pay for access!
Then the next step is to browse through this small list of stocks and see if any one of them fit my favorite patterns .
And when looking at the stocks, I always use these next two indicators to determine what I am going to be trading…
Bollinger Bands
Bollinger Bands were developed by John Bollinger as a price envelope designed to define the upper and lower price range levels of a stock.
Bollinger Band Indicator consists of a middle SMA along with an upper and lower offset band.
And because the distance between the bands is based on statistics, such as a standard deviation, they adjust to volatility swings in the underlying price.
Bollinger Bands help to determine whether prices are high or low on a relative basis, and according to these calculations, price should fall within range 95% of the time!
Let’s take a look at an example chart.
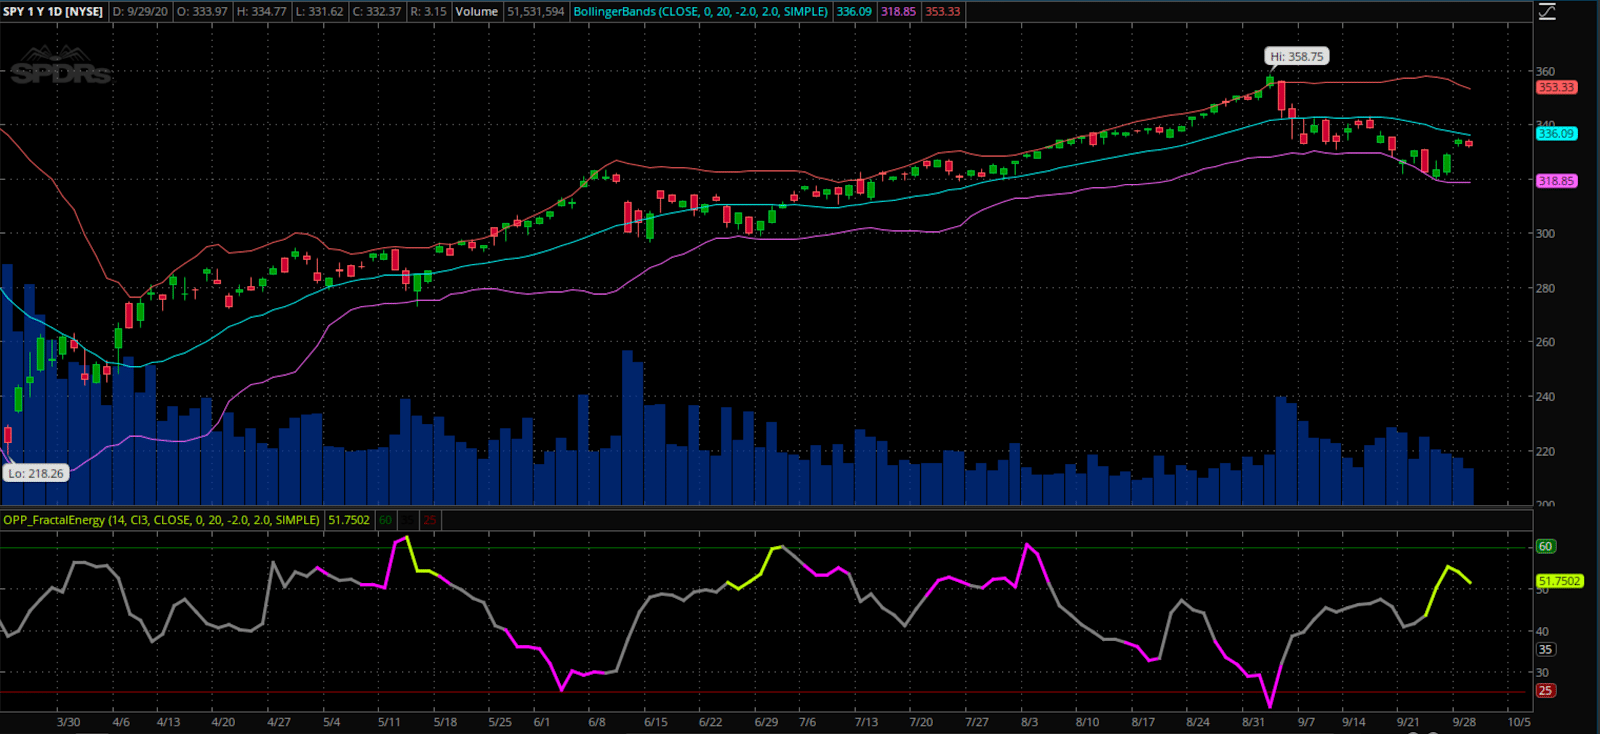
Source: Thinkorswim
How do you read the Bollinger Bands?
The Bollinger Bands consist of three lines as follows:
The Middle (Basis) Bollinger Band – This is a simple moving average of price, usually set to a 20-day timeframe, although that is a variable that can be adjusted any time.
The Upper Bollinger Band – This line takes the 20-day simple moving average of the Middle Band, and then adds 2 standard deviations of that value.
The Lower Bollinger Band – This line takes the 20-day simple moving average of the Middle Band, and then subtracts 2 standard deviations of that value.
So what is the importance of Bollinger Bands, anyways?
By using Bollinger Bands, you can identify reversals as well as trend breakouts very clearly, but how do we use that information in practice?
Credit Spreads
As an options trader, I don’t want to go to the casino…
Instead, I want to BE the casino!
And I do this by trading credit spreads instead of debit spreads.
Option sellers take maximum advantage of the option time decay theory, commonly known as Theta Decay.
OTM options lose value quickly and become worthless at expiration.
Now what do one of these strategies look like?
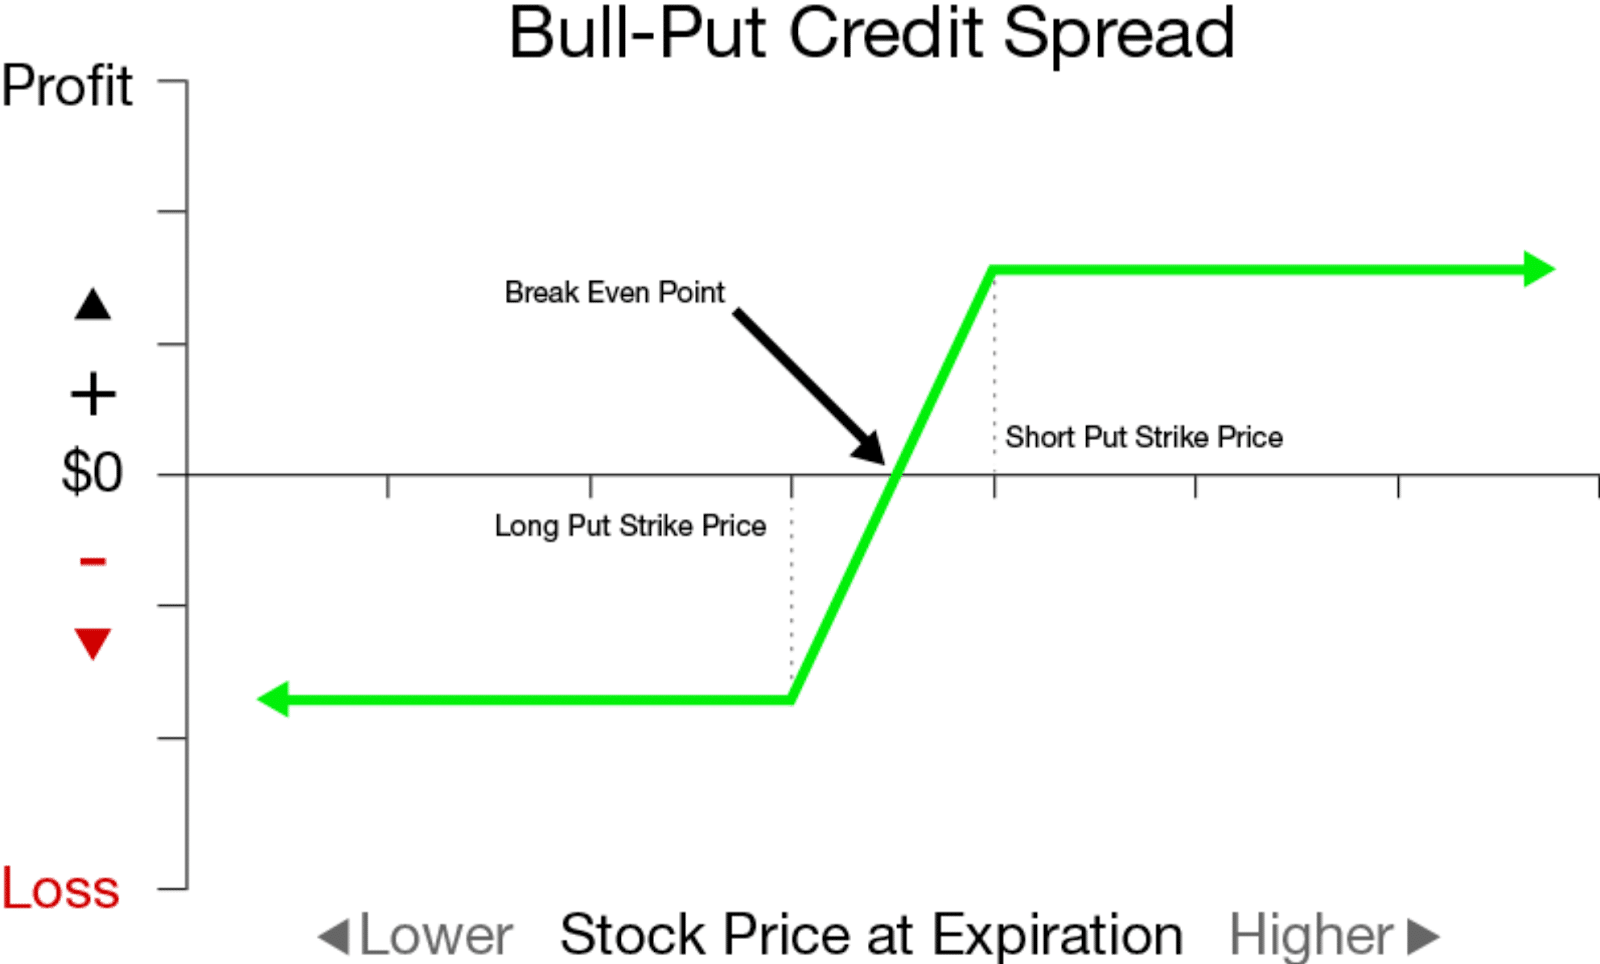
I know this might look scary, but it’s a lot more simple that you might think.
In order to create this strategy, you would want to sell a higher valued put, and buy the lower valued put as protection.
What does this give you?
It allows you to collect a net credit on the trade, which is the difference between the two puts.
But why do I like this trade?
Plus when you generate income from collecting premium, you can steadily return close to 100% returns each and every trade.
Remember traders, there are many ways to make money in this market and selling options is one of my absolute favorite go-to strategies.
Key Points:
- Credit Spreads can profit if the stock goes down, stays the same, or goes up depending on a Call or Put Spread
- Limited risk compared to Naked Puts and Naked Calls
- Puts the house odds in your favor compared to buying Options or Stocks
- Allows you to get paid to take risk unlike stocks
And you see, when it comes to placing a trade, you need these 4 things
- To have the stock selected
- A price range identified
- An indicator to show you strength of the stock
- And an options strategy to tie it all together.
Fractal Energy
As a trader, spending hours going through stock charts and looking for patterns is just part of the day in the life of a professional trader.
To cut down the work that I have to do every day, I only focus on stocks that meet qualifications set by the Fractal Energy Indicator.
When looking to understand what price action is doing you need to reference information other than a basic stock chart to get a true edge in the markets.
And by having an indicator such as the Fractal Energy indicator you can determine stocks that are charged to run or exhausted and ready to stall out.
But first – What are fractals?
The power of fractals allows me to determine the strength of trends and how much “life” is remaining in a stock’s movement.
There are 2 main components of Fractal Energy:
- Markets Fractal Pattern
- The Internal Energy
By combining those two different components you create a single indicator that is able to successfully determine the strength or weakness of a trend on any market or stock.
Here are two examples of the Fractal Energy impacting one of the largest markets and most well-known stocks out there.
The SPY:
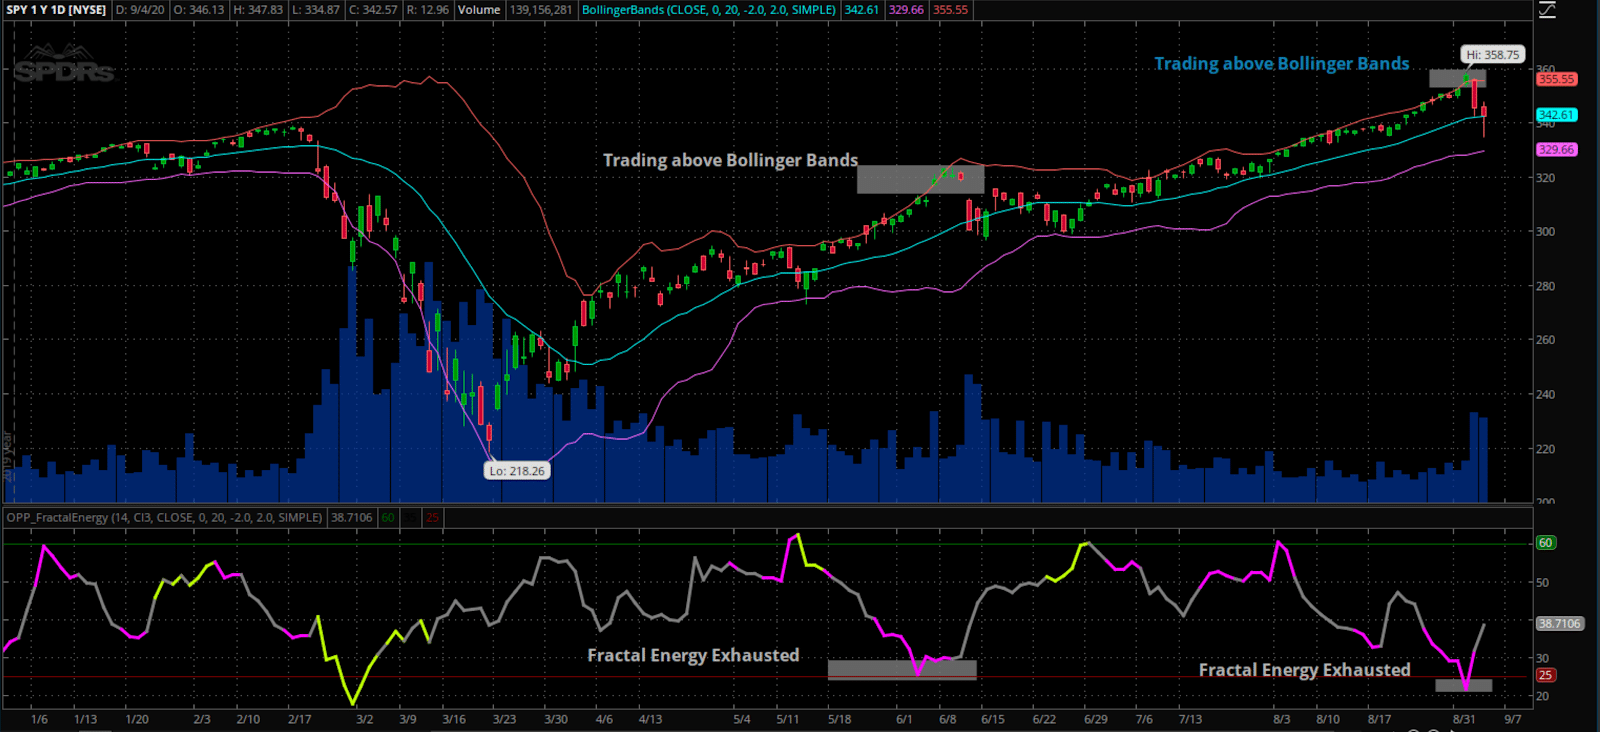
Source: Thinkorswim
AAPL:
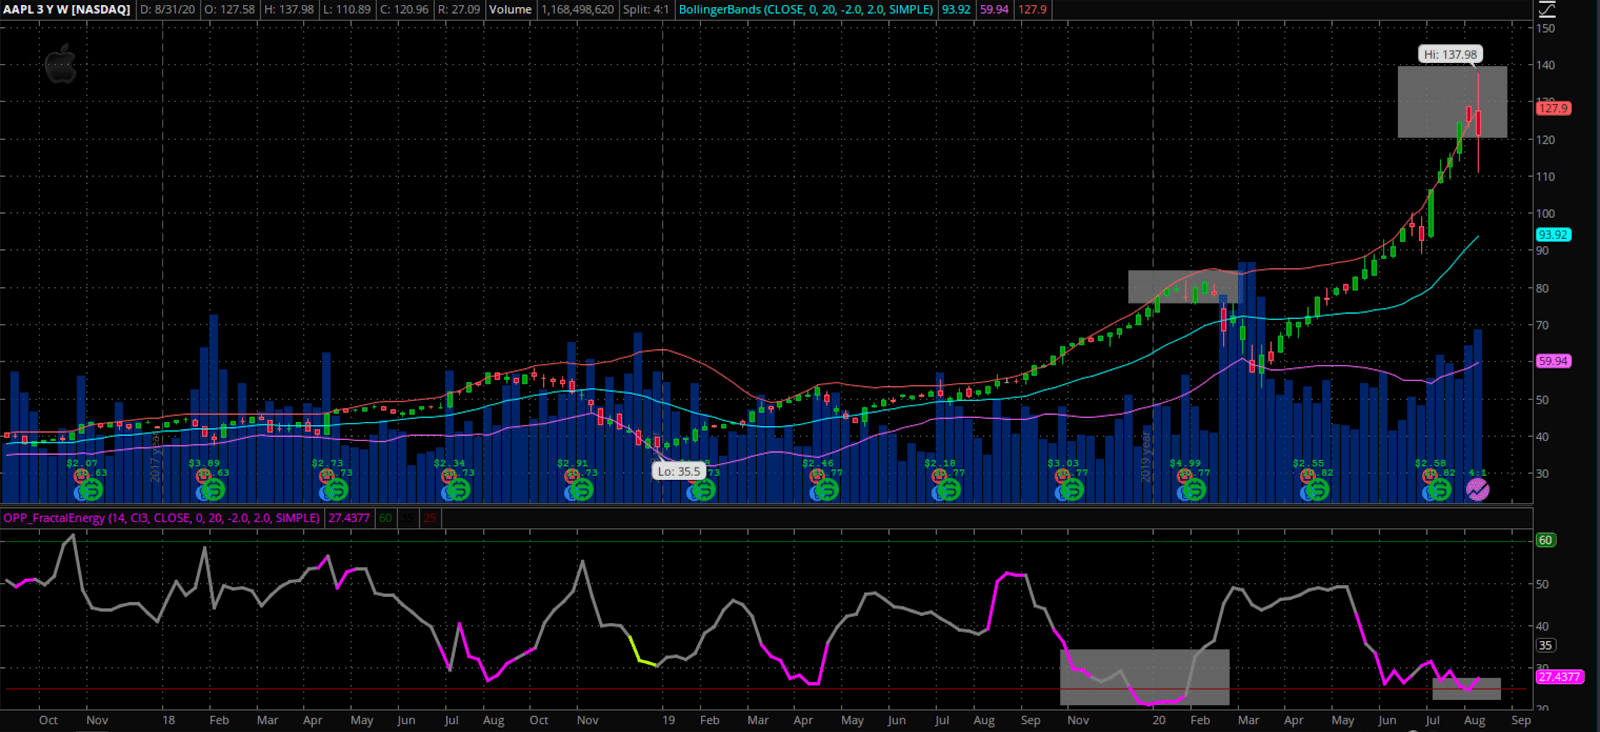
Source: Thinkorswim
Now let’s talk about how I put it all together to find the trades for the week ahead.
Putting it all together
I know this market is crazy… and even overwhelming to many.
But you need to trust the tools you use in order to trade it safely.
And two of those tools are the Bollinger Bands, Fractal Energy, and Credit Spreads.
Once they are combined, these indicators are some of the best tools a trader can deploy in markets that are unpredictable.
When looking at these strategies combined, this really is where statistics and probability really shine and make for a highly profitable trading opportunity.
Not only do I trade using an indicator that tells me 95% of the time price will stay inside a range, I also combine it with an options strategy that can pay me 100% ROI on my trade if timed correctly to the markets.
So… to recap what makes this trade a really high probability winner.
-
- The Options sellers always have statistical advantages over buyers. That’s a built-in feature for the entire options market, regardless of calls or puts.
- Trading credit spreads can pay me 100% returns, which cannot be done when buying calls or even the stock outright.
- Using Fractal Energy to tell me when stocks are going to be charged or charging to determine what is coming up for the stock
Click here to learn how I use the Bollinger Bands weekly to determine the market direction
0 Comments