Everyone knows these sayings
Buy high, Sell higher
and
Buy low, Sell High
But little do they know, the water is a lot deeper than what’s expected when talking about doing just those two things.
And without knowing WHAT stock to buy, and WHEN to buy that stock, you are pretty much setting yourself up for a losing trade.
Combine this with options trading, and now you are looking at 80% chance of a losing trade which is reported by the CBOE !
Recently, I’ve gone on a winning streak that would embarrass even the best hedge funds in the world by using these three simple to follow and replicate indicators.
Want to know how I’ve done it?
Technical Indicators Are The Tools Of A Trader
There are literally thousands of technical indicators that are available to trade with
Don’t get me wrong, many are extremely useful and have been developed by the brightest and smartest minds in the world.
But for me, I don’t need anything complex and I focus on trading using only 3 technical indicators!
So let’s take a look at my indicators and why I chose each one for the job at hand
Bollinger Bands
Bollinger Bands were developed by John Bollinger as a price envelope designed to define the upper and lower price range of a stock.
Bollinger Band Indicator consists of a middle Simple Moving Average (SMA) along with an upper and lower offset band.
Since the distance between the bands is based on statistics, such as a standard deviation, they adjust to volatility swings in the underlying price.
How do you read them?
Bollinger Bands help to determine whether prices are high or low on a relative basis, and according to these calculations, price should fall within range 95% of the time!
Pro Tip: Skinny or Narrow bands means low volatility and wide or expanded bands usually means high volatility.
You don’t want to miss The 5 Ways To Trade Bollinger Bands where I explain the different trading styles you can create around this unique indicator
Let’s take a look at an example chart.
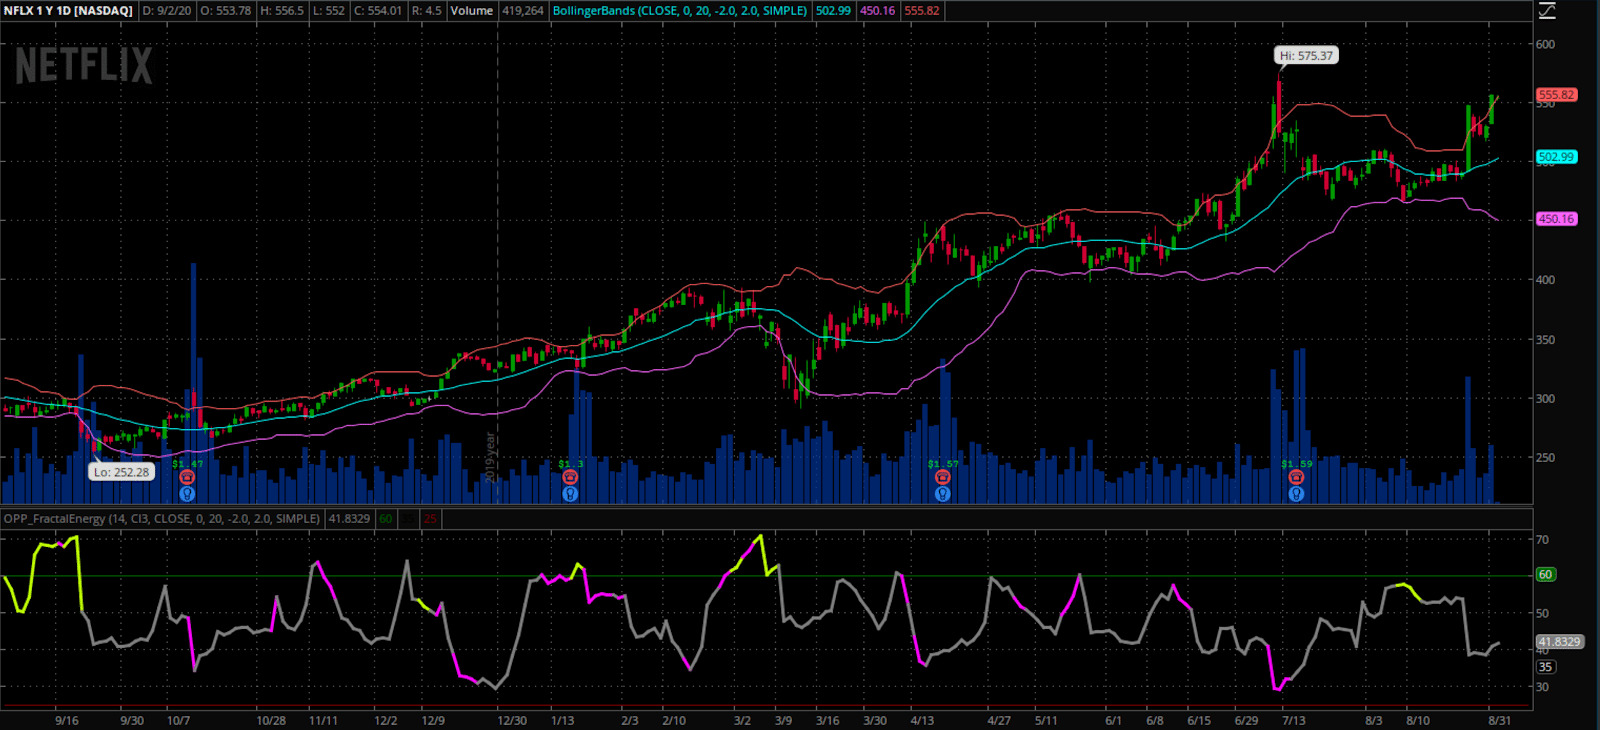
Source: Thinkorswim
You may have noticed right away that price tends to fall inside the Bollinger Band nearly every single trading day with very few actually making it outside the two bands.
And if the price did trade outside of the bands, the stock made sure to rebound quickly to get back inside of it.
How this indicator works:
- When Bollinger Bands tighten, there is a high likelihood that price will have a sharp move
- When the bands separate by an unusually large amount, this is showing a significant increase in volatility or a gap in stock price.
- The stock price can exceed and even hug or ride the band price for extended periods of time.
- Price has the tendency to bounce within the bands’ envelope, touching one band and moving back towards the other.
- You can use the middle SMA or opposite band as target prices and exits for your trading
- If prices move outside of the band, it’s expected to see a trend continuation until the price moves back inside the band.
Now you don’t want to just get out there and start buying and selling the tops and bottoms of every Bollinger Band you come across!
Fractal Energy
Every indicator is great, but if they are used by themselves you typically don’t have a defined edge in your trading.
Let’s take a closer look
Fractal Energy is the cornerstone indicator of Options Profit Planner and its power is used to pinpoint key market reversals.
The power of fractals allows me to determine the strength of trends and how much “life” is remaining in a stock’s movement.
There are 2 main components of Fractal Energy:
- Fractal Pattern
- Energy
And when you use the power of this indicator you will be able to successfully determine the strength or weakness of trends on any stock.
Energy is the term used to describe the stored or potential energy a stock has built up. Like a spring that is compressed, it stores potential energy and erupts when you release the force that is keeping it held together.
And by combining those two different components, you create a single indicator that is able to successfully determine the strength or weakness of a trend on any stock.
Fractals tap into the inner strength of every stock across every time frame giving you the most comprehensive understanding of what a stock is going to do in the future
Examples of Fractal Energy Causing A Stock To Explode
Here is a recent trade in TSLA that shows the power of Fractal Energy and why you shouldn’t worry about the intraday price action of a stock!
Now what if I told you that you only needed a single indicator to understand exactly what a stock is doing internally.
That’s where Fractal Energy comes into action
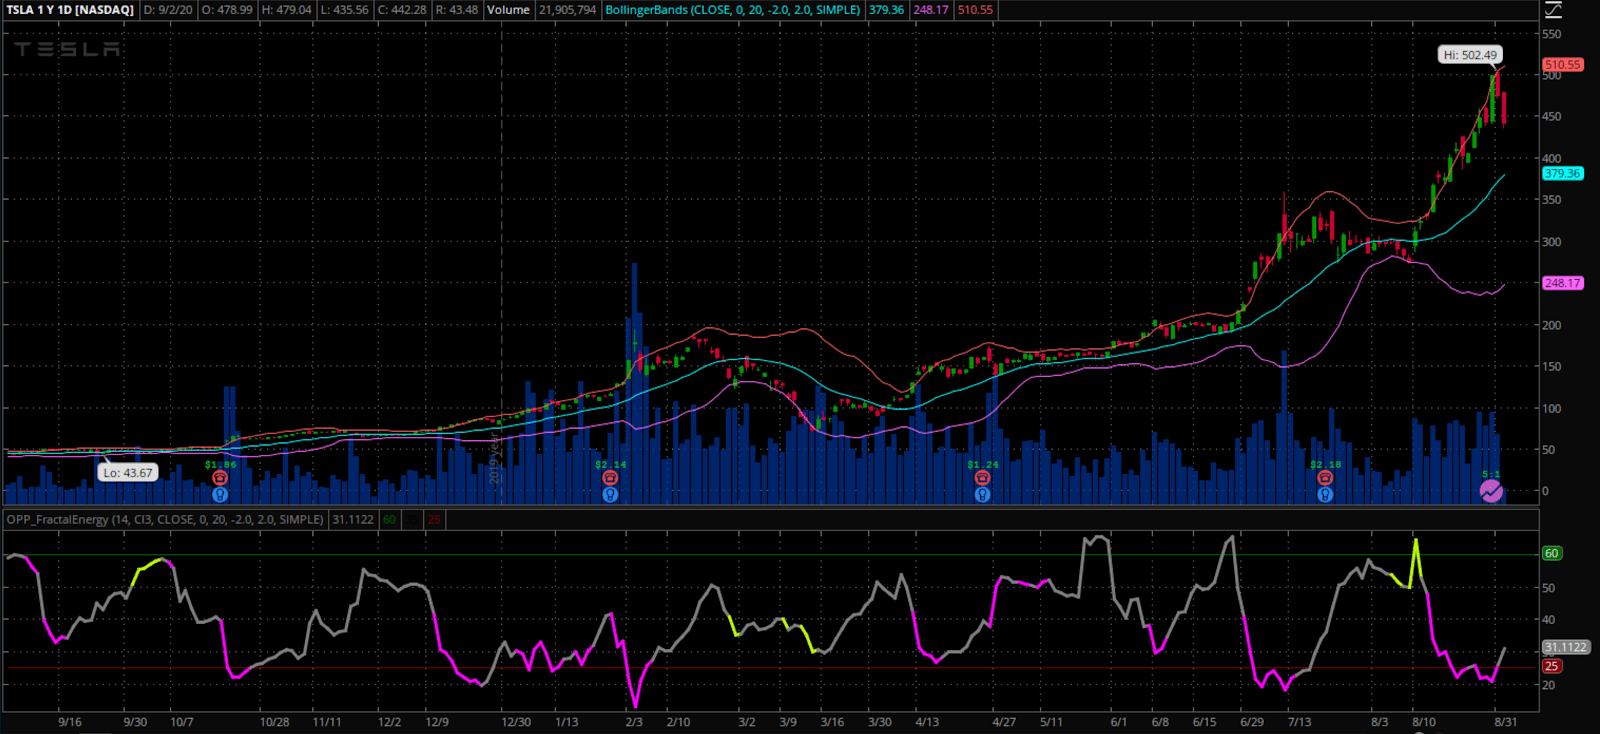
Source: Thinkorswim
Now this might look wacky at first, but let me show you exactly what the Fractal Energy is doing
You see, Fractal Energy is the amount of ‘stored energy’ in a stock and it’s likelihood to trend or go sideways in the near future.
Let’s take a closer look at what this indicator showed us exactly.
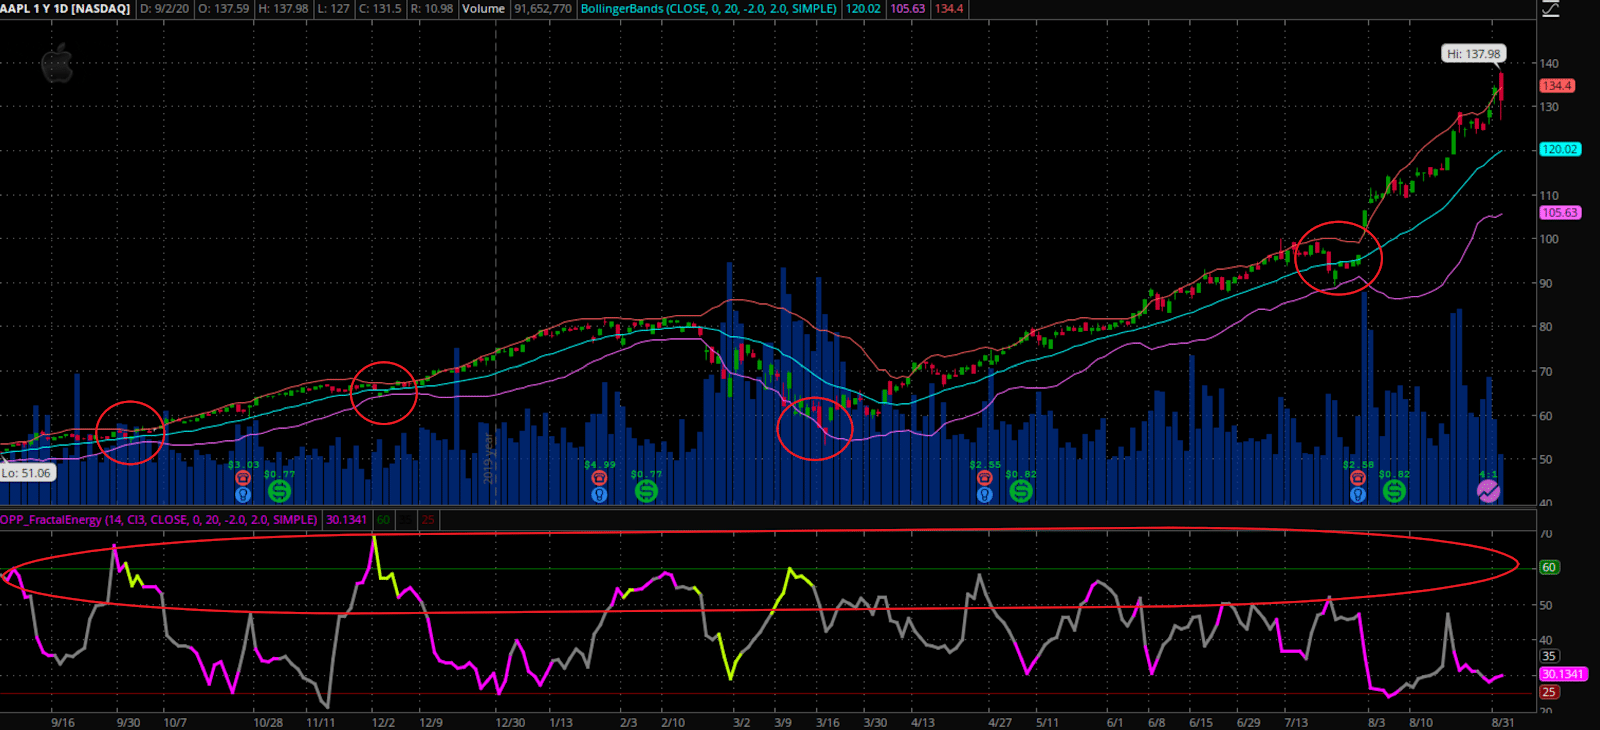
Source: Thinkorswim
You see, the “charged zone” in the Fractal Energy is where the money shot is
Every time the Fractal Energy got in that charged state and the lower Bollinger Bands were touched, TSLA got a spark lit and took off like a rocket.
Fractal Energy vs The Competition
When looking at a stock chart, many times a trader is just guessing at what levels to enter their trade at. To make it worse, there is hardly any information that a trader can reference just by looking at standard indicators.
When reading the RSI, when a value is near or over 70, a stock is considered to be overbought.
At this point, a trader would most likely remove shares of the stock they own at these levels, or execute a short trade.
And that’s exactly the opposite of what a trader should really be doing at certain key levels.
The RSI
Let’s take a closer look at a sample trade on TSLA with Overbought RSI readings.
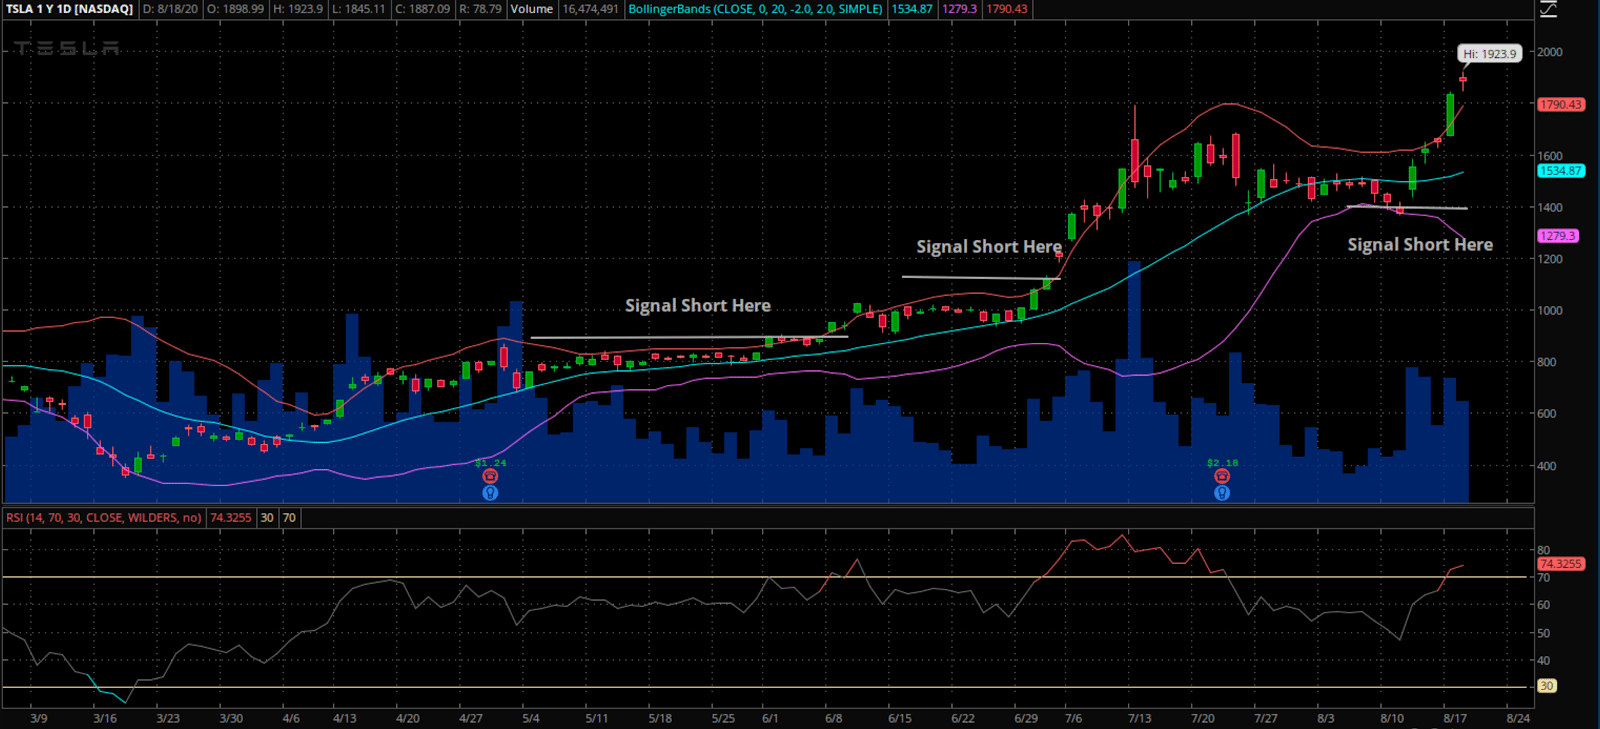
Source: Thinkorswim
According to traditional RSI strategies, if the value of the indicator was to reach overbought, the trader would look to short the stock.
And clearly, looking at the chart, this would have been a terrible spot to go short TSLA.
This happened multiple times at some of the best opportunities to get long this stock.
Why did this happen?
Because RSI is a simple calculation that measures the number of moves up and down to determine the ratio of up bars to down bars on a stock.
This ratio is inherently flawed as it doesn’t take into account any energy the stock might have built up going into the overbought zone.
Selling Options and Credit Spreads
In order to get long or short the markets, a trader is left with only a handful of choices, and those are buying or selling stock or buying calls or puts.
And to be honest, buying options is usually a terrible idea.
Although there are times when you could be right on the direction and still lose on the trade because of other factors such as Implied Volatility decreasing the price of the stock on you.
One strategy you might not have heard of is a credit call spread, and that’s the trade we are going to focus on when looking to short the stock.
Definition: A credit spread, or net credit spread is an options strategy that involves a purchase of one option and a sale of another option in the same class and expiration but different strike prices. It is designed to make a profit when the spreads between the two options narrows.
Simply put – a credit spread strategy will make you money, while a debit spread strategy will cost you money.
This is the house vs the gambler.
And at Options Profit Planner, I want the house odds in my favor as the business owner and expect to have steady money coming in, not going out!
A credit spread involves selling a high-premium option while purchasing a low-premium option in the same stock and option type.
As a credit trader you have 4 strategies to generate income for your business if you want to go long a stock. (Each strategy has its own aggressiveness to the direction of the underlying move as noted below.)
These trades to long the markets are:
- Short Put – Aggressive Long
- Short Call – Moderate Long
- Short Put Spread – Aggressive Long
- Short Call Spread – Moderate Long
Wrapping up
A fractal is a never-ending pattern and is repeatable and found across everything in nature, such as, coast lines, pine cones, and snowflakes.
Fractals are created by repeating a simple process over and over in an ongoing loop. Therefore. a pattern working on a weekly time frame will work all the way down to a 1 minute time frame.
Which is exactly why I want the Fractal Energy to work for me!
And when I am selling options and trading credit spreads, I want to put the house odds in my favor!
And only then do you then have a winning combination that can give you the best shot at making money in the markets!
Now – start tapping into the inner workings of the stock market and make Fractal Energy a cornerstone of your trading business!
0 Comments