Options Profit Planner
The core strategy at Options Profit Planner is based around a few core filters, based on technical and fundamental data of a stock.
But it’s pretty surprising that traders overlook fundamentals and buy or sell based on momentum.
And that blows my mind.
The excuse is that price action is more of a tradable signal than fundamental information.
Now, they might be right about certain intraday trading strategies, that doesn’t necessarily mean it’s true across the board.
In example…
What if you are selling naked puts and then you are assigned on a stock that you end up having to hold for 5 years in order to make a decent ROI?
Wouldn’t you want to make sure your money is safe and you are owning a high quality stock?
I know I would…
So, what do I do?
Fundamental Analysis
I use a fundamental filter to narrow down the list of stocks to trade on. As an example here are just a few of the many criteria I look for in stock before taking a position.
Example criteria for a high quality stock:
- Us-Based only
- Volume > 500k
- ROE > 10%
- Over $2
- All positive analyst reviews (hold or better)
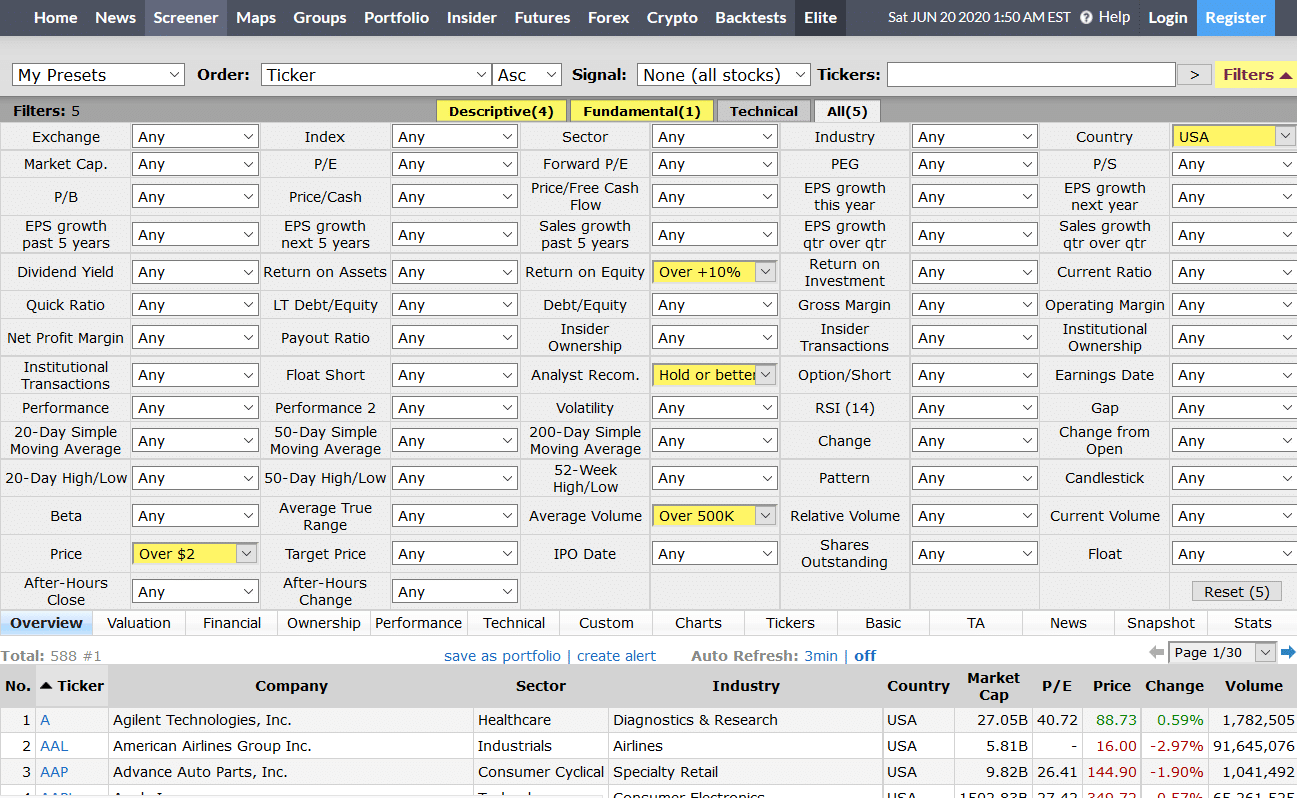
Source: Finviz
Here is an example of the screener that I use, and right away we were able to narrow down the list of stock from 10k down to about 600 just from these simple criteria.
And the more you add, the further this gets narrowed down and could eventually give you the exact trade you could place.
Now that we have the fundamentals covered, let’s take a look at the price action and technical patterns to filter down the list of stocks to a single trade.
Next…
Technical Analysis
The technicals of Options Profit Planner are based around two critical indicators, the Fractal Energy and Bollinger Bands.
Let’s dive in and take a look at each of these indicators and how they help to navigate the markets.
Bollinger Bands were developed by John Bollinger as a price envelope designed to define the upper and lower price range levels of a stock.
Bollinger Band Indicator consists of a middle Simple Moving Average (SMA) along with an upper and lower offset band. Because the distance between the bands is based on statistics, such as a standard deviation, they adjust to volatility swings in the underlying price.
How do you read them?
Bollinger Bands help to determine whether prices are high or low on a relative basis, and according to these calculations, price should fall within range 95% of the time!
Let’s take a look at an example chart.
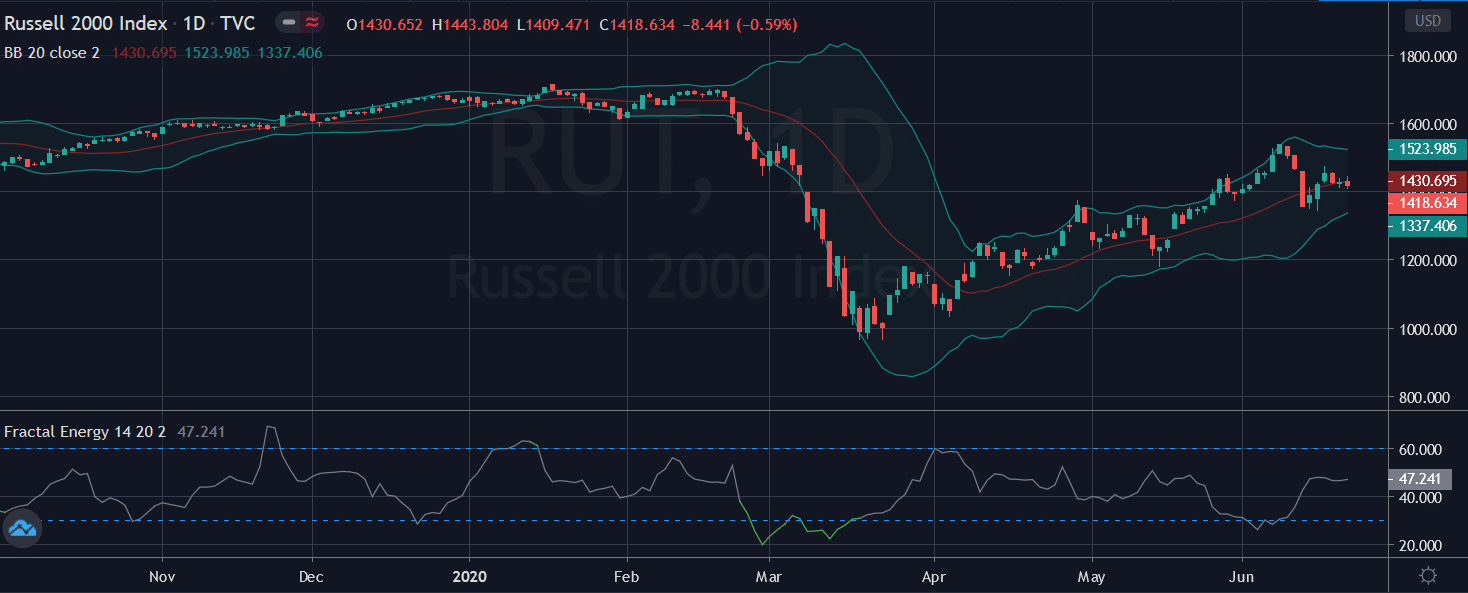
Source: Thinorswim
You may have noticed right away that price tends to fall inside the Bollinger Band nearly every single trading day with very few actually making it outside the two bands.
And if the price did trade outside of the bands, the stock made sure to rebound quickly to get back inside of it.
How this indicator works:
- When Bollinger Bands tighten, there is a high likelihood that price will have a sharp move
- When the bands separate by an unusually large amount, this is showing a significant increase in volatility or a gap in stock price.
- The stock price can exceed and even hug or ride the band price for extended periods of time.
- Price has the tendency to bounce within the bands’ envelope, touching one band and moving back towards the other.
- You can use the middle SMA or opposite band as target prices and exits for your trading
- If prices move outside of the band, it’s expected to see a trend continuation until the price moves back inside the band.
What is Fractal Energy
Fractal Energy is the cornerstone indicator of Options Profit Planner and its power is used to pinpoint key market reversals.
The power of fractals allows me to determine the strength of trends and how much “life” is remaining in a stock’s movement.
There are 2 main components of Fractal Energy:
- ) Fractal Pattern
- ) Energy
And when you use the power of this indicator you will be able to successfully determine the strength or weakness of trends on any stock.
Let’s take a look at how this works…
Credit Strategy
3 of my favorite strategies are:
- Naked Put
- Credit Put Spread
- Credit Call Spread
So let’s take a look at each and see how they are trading strategies that can generate income.
Naked Put
The Naked Put Strategy is a go to strategy for many options sellers since it has the advantage of owning a stock if the trade goes bad.
What is a Naked Put?
A naked put, or short put, is typically traded when a trader assumes that the underlying security will rise between the time of execution and the expiration date of the option.
The trader will execute this strategy by selling a put option with no corresponding short position in their account. Since there is no additional position, this is considered an uncovered trade, meaning that the trader would be required to own stock if the buyer should exercise their right to the option the seller is holding.
A put option is designed to create a profit for a trader who correctly forecasts the price of the security will fall substantially, past the breakeven! But as a put seller, you actually collect revenue on this trade if the option rises, falls, or goes sideways.
Takeaways:
- A naked put is an option strategy that involves selling put options.
- When put options are sold, the seller benefits as the underlying security goes up, down, or sideways in price.
- Naked refers to an uncovered position, meaning one that has no underlying security associated with it.
- The risk of a naked put position is that if the price of the underlying security falls, then the option seller may have to buy the stock away from the put-option buyer.
Credit Put Spread
A credit put spread is a type of credit option strategy that is used when a trader expects an increase in the value of an asset.
The credit put spread is equivalent to going long the stock, except there is no unlimited risk potential.
The credit put spread is placed by simultaneously purchasing a put option at a higher strike price and selling a put option at a lower strike price in the same expiration month.
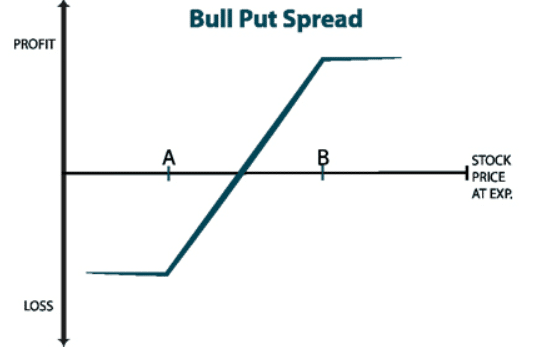
This is considered a limited-risk trade since the selling of the put option is covered by the purchasing of a lower-strike put option.
Risk parameters of a Credit Call Spread are:
- Max Gains : Net premium received
- Max Loss : High strike – Low strike – Net premium received
- Breakeven : short put strike – net credit received
Credit Call Spread
A credit call spread is a type of credit option strategy that is used when a trader expects a decrease in the value of an asset.
The credit call spread is equivalent to going short the stock, except there is no unlimited risk potential.
The credit call spread is placed by simultaneously purchasing a call option at a higher strike price and selling a call option at a lower strike price in the same expiration month.
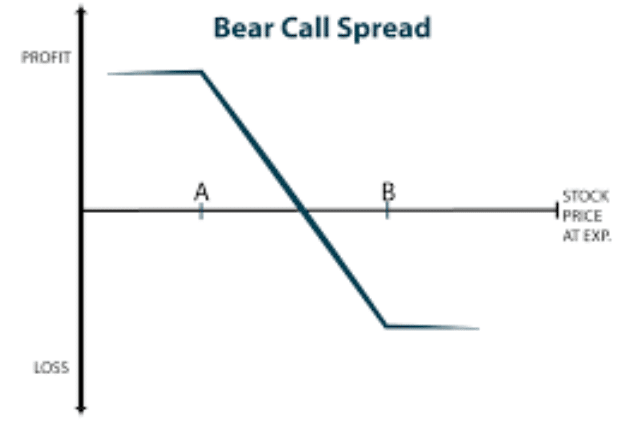
This is considered a limited-risk trade since the selling of the call option is covered by the purchasing of a higher-strike call option.
Risk parameters of a Credit Call Spread are:
- Max Gains : Net premium received
- Max Loss : High strike – Low strike – Net premium received
- Breakeven : short call strike + net credit received
Wrapping up
To summarize, premium selling is known to generate a wildly profitable and extremely smooth equity curve.
There is the risk of an occasional large loss, but this is mitigated with the use of credit spreads instead of naked options.
The return of a premium selling options book is that of a mean reversion stock trading system, with a large number of small wins with the occasional ‘fat tail’ trade.
Selling Naked Puts is one of my favorite strategies since it allows me to purchase stocks at a discount and get paid doing so!
Want more proof that selling options is the only way to consistently make money?
0 Comments