I get asked a lot about how I trade options… but the one question that always pops up is how can I find those huge percent winners.
Trading is a lot like a tale from a fishing trip… the more the story is told, the larger the caught fish becomes.
It doesn’t matter what you trade – there is enough money in the stock market to go around for all of us to grab a piece.
From penny stocks to blue chips, it just takes a steady and consistent trading strategy to bring in consistent positive returns month over month.
But what if I told you that there was one strategy that outshines even the best stock pickers returns?
I’m talking about returns of 50% or even as high as 100%
This strategy is safer than trading equities and easy to learn.
What am I referring to?
Options Profit Planner
This is not your average fish tale…
Let’s take a look at exactly what you need to learn to land trophy-winning trades week-after-week.
But before we get started, there are a few basic terminologies that you want to be familiar with.
The Short Put:
This is the go-to strategy selling options for many professional traders. It’s believed to be a moderate risk strategy that is deployed when the trader is very bullish on the underlying.
A short put (naked put) strategy is moderate risk because a trader has assignment risk on a stock if the puts are exercised by the buyer.
To trade this strategy – it’s best that the trader only sells puts on stock they are willing to own throughout any circumstances.
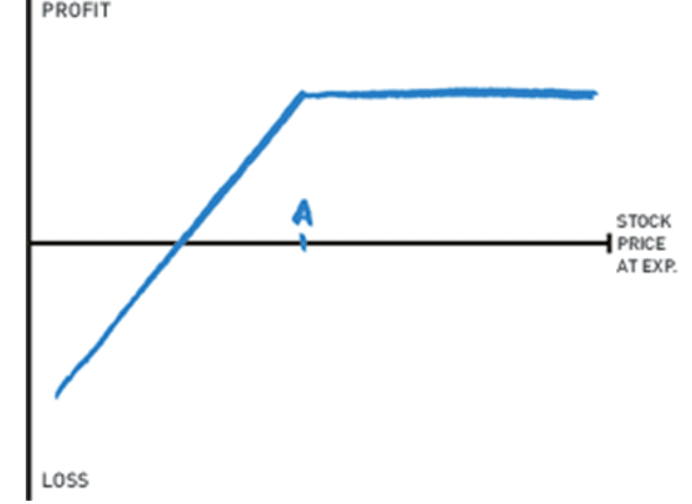
But this also is a huge benefit for the trader.
The naked puts has one distinct advantage for the trader and allows the trader the opportunity to purchase a stock at a discount!
Even though the chart looks like unlimited losses, the value of the asset going to $0 is the theoretical max loss.
There are some critical metrics a short put trader should pay attention to, and that is the breakeven and max profit potential on the trade.
Trade Metrics:
Total Profit = Credit collected
Breakeven = Strike price – credit received
Max Loss = Total $ value of stock at strike sold. ie) sell 1 contract at $3 x 100 shares = $300 max loss
Credit Put Spread
This is the cream of the crop strategy when it comes to taking advantage of option premium while having an underlying directional bias.
Similar to the Naked Put, the trader would expect that a stock is going to remain neutral to positive to the direction of the movement ahead.
The credit put spread is a trade that is initiated by purchasing a put option at a higher strike while simultaneously selling the put at a lower price, in the same direction.
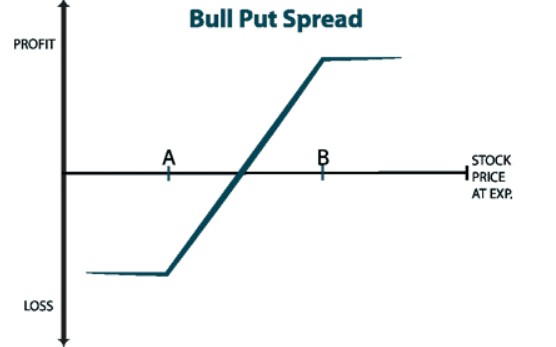
This is considered a limited-risk trade since the selling of the put option is covered by the purchasing of a lower-strike put option.
Trade Metrics:
Max Profit: Net premium received
Max Loss: High strike – low strike – net premium collected.
Finding The Trades
Finding the trades for Options Profit Planner starts with determining the stocks that have just the right amount of Fractal Energy
But you can’t just buy any old stock that reaches an overbought reading or touches the bottom of a Bollinger band.
There are two filters that you need to use to find the trades to take the best setups that are forming.
Using www.finviz.com a popular free scanning tool you will be able to filter down the stock you want to review by just inputting the criteria you’d like to see.
For example, we would want:
- Price > 10
- Average Daily Volume > 1m
- Price near major support
- Price near 52 week low
That’s where Fractal Energy comes into the picture when looking for a level to buy the reversal.
Just because CMG didn’t meet the 52 week low requirements of the scanner, I couldn’t pass up this trade as it sold off right into major support levels.
Let’s take a look at a recent trade in Chipotle Mexican Grill, CMG, and how this played out.
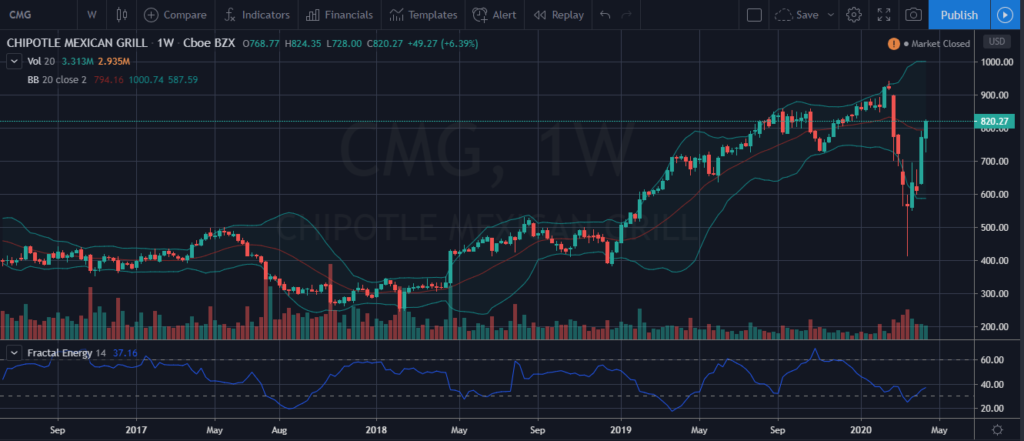
Source: Tradingview
As you can see on the weekly chart, CMG spiked lower and sharply reversed back towards all-time highs.
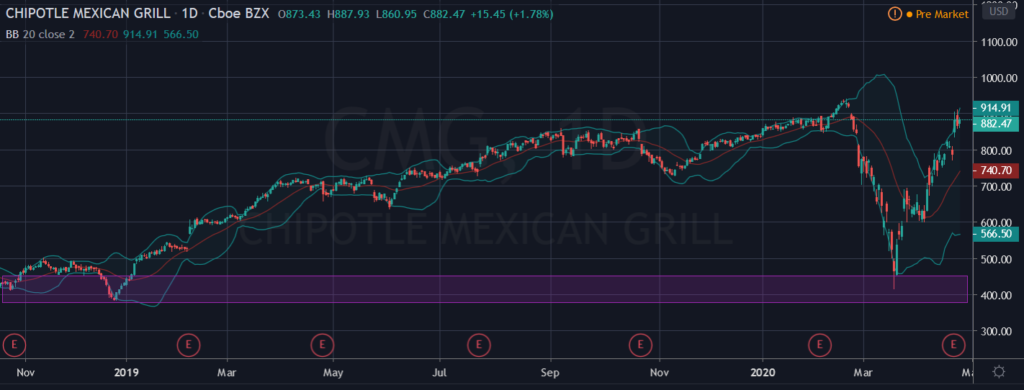
Source: Tradingview
On the daily timeframe, it bounced right at the 52-week lows even though the weekly had room to fall, it didn’t make sense that we would see the weekly chart get that low…
And as a trader- those are the “V” bottom pattern you hunt and search for every day.
But if you were to simply buy CMG once it hit the Bollinger Band without using a secondary indicator, you would have been left holding serious losses.
This is where the Fractal Energy Indicator shows the stocks that are exhausted in their move and are set up to bounce.
Fractal Energy
The power of fractals allows me to determine the strength of trends and how much “life” is remaining in a stock’s movement.
There are 2 main components of Fractal Energy:
- Markets Fractal Pattern
- The Internal Energy
When looking to trade the Fractal energy, there are some key setups that you want to be aware of.
The Fractal Readings:
- Exhausted – the internals of the stock is skewed to being out of energy and cannot trend any further in the direction it was going.
- Charged – the internals of the stock is skewed to being stored off of energy and the stock is capable of more room if it wants to fully charge and run.
And with Fractals, many times the signals are from higher time frames and it’s a good idea to check to see what they are doing prior to any trade.
For example, let’s take a look at the weekly chart on the CMG.
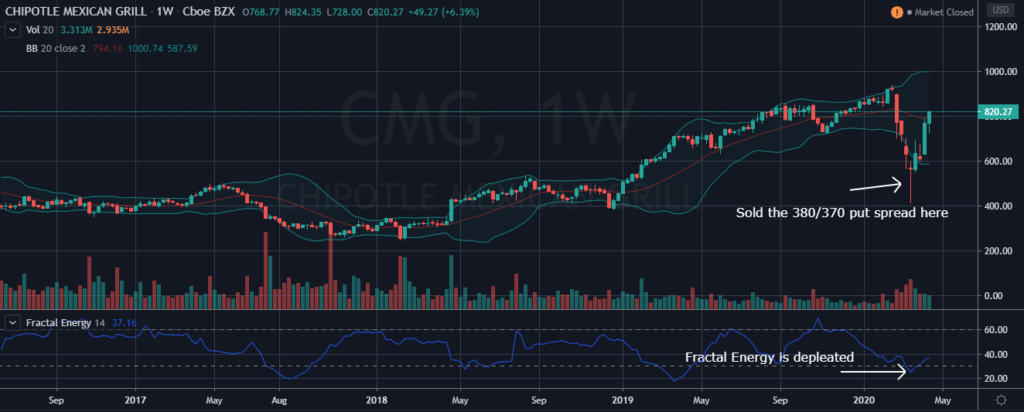
Source: Tradingview.com
In this chart you can see two things:
- The markets have continued to sell off and bounced from their lows
- Fractals are exhausted and fully depleted and appear to be generating energy before heading higher.
The Trade
After seeing this price action, I decided to sell the Sept ’20 $380/370 put spread for $1.25.
Sell Sept ‘20 380 @ 5.00
Buy Sept ‘20 370 @ 3.75
Total Risk: $10.00/contract
Total Profit: $ $1.25/contract
This trade executed a short put spread to collect the premium on expensive options contracts.
Definition: A credit spread or net credit spread is an options strategy that involves a purchase of one option and a sale of another option in the same class and expiration but different strike prices. It is designed to make a profit when the spreads between the two options narrows.
Simply put – a credit spread strategy will make you money, while a debit spread strategy will cost you money.
Wrapping up
That’s about all it takes to generate a winning strategy from top to bottom.
The steps are simple:
- Determine how to filter out stock
- Use technical indicators to find buy levels
- Confirm internal momentum with Fractals
- Execute using a credit strategy in options markets.
For my trading, I make sure that I utilize an options trading style focused around credit trading to generate income for my business.
Since trading is a business, I always focus on the money coming in and the money going out!
Credit spreads give unique advantages to traders over debit spreads, with the most important being that you are paid upfront to place a trade!
And as a business owner, I want to make sure I know how much money I have coming in and out each and every month.
0 Comments