What if I told you it’s possible to achieve win rates above 75% — with some even higher than 90%?!
And you don’t have to be a math whiz or an IVY League MBA to do it.
However, you will need tools.
Ones which can help you access the landscape of the overall market.
I’m talking about:
- Measuring volatility
- Identifying bottoms and tops
- Discovering how strong or weak a trend is.
This one key indicator is so popular, but wildly misunderstood.
I’m serious.
But before you can apply it effectively, it’s critical that you understand this unknown fact about them.
Bollinger Bands
Bollinger Bands were developed by John Bollinger as a price envelope designed to define the upper and lower price range of a stock.
The Bollinger Bands Indicator consists of a middle Simple Moving Average (SMA) along with an upper and lower offset band. Since the distance between the bands is based on statistics, such as a standard deviation, they adjust to volatility swings in the underlying price.
How do you read them?
Bollinger Bands help determine whether prices are high or low on a relative basis, and according to these calculations, price should fall within range 95% of the time!
Let’s take a look at an example chart:
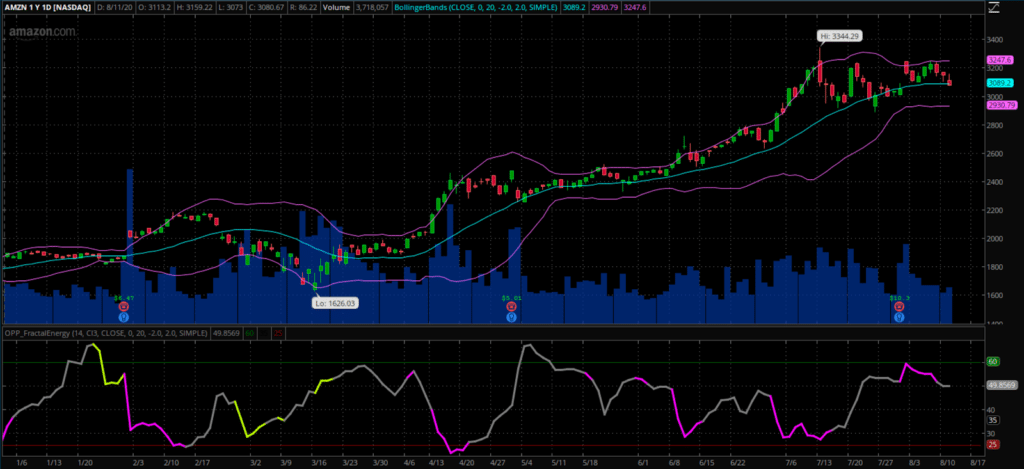
Source: Thinkorswim
You may have noticed right away that price tends to fall inside the Bollinger Bands nearly every single trading day with very few actually making it outside the two bands.
And if the price did trade outside of the bands the stock made sure to rebound quickly to get back inside of it.
How this indicator works:
- When Bollinger Bands tighten, there is a high likelihood that price will have a sharp move
- When the bands separate by an unusually large amount, this is showing a significant increase in volatility or a gap in stock price.
- The stock price can exceed and even hug or ride the band price for extended periods of time.
- Price has the tendency to bounce within the bands’ envelope, touching one band and moving back towards the other.
- You can use the middle SMA or opposite band as target prices and exits for your trading
- If prices move outside of the band, it’s expected to see a trend continuation until the price moves back inside the band.
Let’s take a look at a chart of a recent trade, OLED, that was nearly a 100% winning trade that I just had.
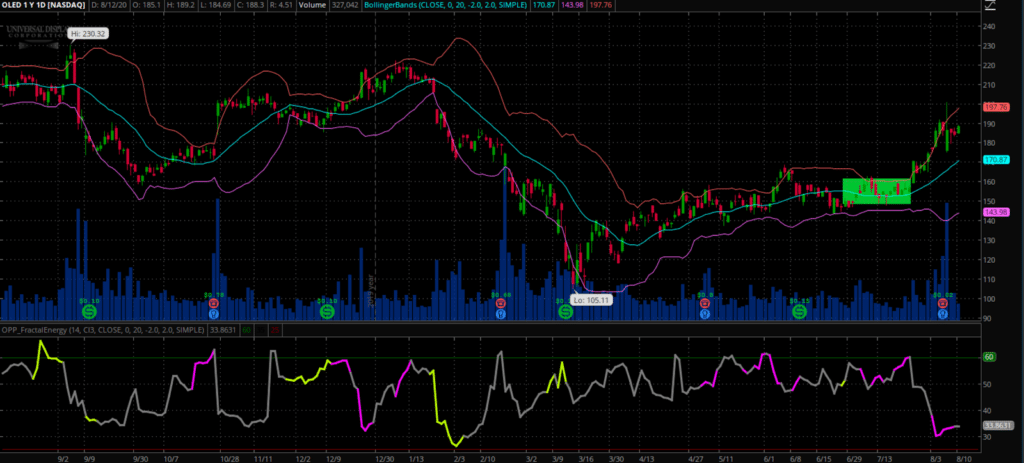
Source: Thinkorswim
Here you can easily see exactly the many signals the Bollinger Bands will give a trader from the items that were listed above.
In a quick glance the trader will see:
- Tightening of bands can lead to breakouts
- Stock trends higher, riding upper band
- Trader can buy the moving average the entire way up if they are aggressive
- Price drops suddenly below lower band and snaps back inside the next day acting as a price barrier seen at the Long Signal
And now at this point, the OLED came off with nearly 100% ROI !
Placing your trade
Let’s take a look at my most recent profitable trade, OLED, and how I used these indicators to trade the stock to the long side.
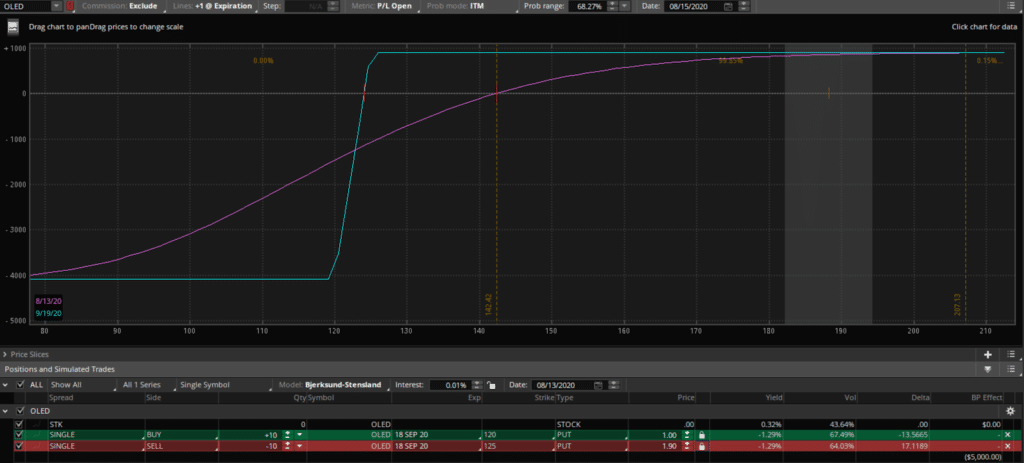
Source: Thinkorswim
Trade Details:
- Sell 18 Sept 20 125 Put
- Buy 18 Sept 20 120 Put
Net Credit : $0.90
Max Profit $900
Putting it all together
I know this market is crazy… and even overwhelming to many. But you have to trust the tools that everyone uses to trade safely.
And three of those tools are Fractal Energy, Bollinger Bands, and Credit Put Spread. When they are combined, they’re one of the best strategies a trader can deploy in markets that are unpredictable.
When looking at these two strategies combined, this really is where statistics and probability really shine and make for a highly profitable trading opportunity.
Not only do I trade using an indicator that tells me 95% of the time price will stay inside a range, I also combine it with an options strategy that can pay me 100% ROI on my trade if timed correctly to the markets.
So… to recap what makes this trade a really high probability winner.
- The Options sellers always have statistical advantages over buyers. That’s a built-in feature for the entire options market, regardless of calls or puts.
- Trading credit spreads can pay me 100% returns, which cannot be done when buying calls or even the stock outright.
- Lastly, combining a proven indicator into my trading system that when signals a stock is oversold both statistically and on the charts. Remember, there is a 95% chance it will head higher and not lower.
0 Comments