Just a few short months ago we were talking about the worst stock market collapse in history.
Coupled with soaring unemployment levels which have not been seen since the Great Depression…
Very few people predicted stocks would rebound in the fashion they have.
But that’s exactly what happened…staging a ferocious rally…which now sees the Nasdaq back to all-time high territory…
Looking back, was there a way to play for the bounce…without “having to try and catch a falling knife?”
The answer is yes…
Even more surprising… Fractal Energy signaled exactly when this was going to happen…
Don’t believe it?
Let’s look at the tale of the tape…
Fractal Energy
The Fractal Energy Indicator is a measure of the internal energy of a stock and signals to the trader the likelihood of trend or chop in the near term.
The power of fractals allows me to determine the strength of trends and how much “life” is remaining in a stock’s movement.
There are 2 main components of Fractal Energy:
- Markets Fractal Pattern
- Fractals are found throughout everything in nature, from plants to shorelines… and even the financial markets!
- The Internal Energy
- Energy is the term used to describe the stored or potential energy of a stock. Potential energy is like a spring that is compressed, that is ready to erupt when you release the force that is keeping it held together.
So by combining those two different components you create a single indicator that is able to successfully determine the strength or weakness of a trend on any stock.
Now that we covered what Fractals are, let’s take a closer look at what the Fractal Indicator is and how it can accurately signal a major pivot in the markets.
Fractal Energy Indicator
The Fractal Energy Indicator is a momentum indicator that measures the internal energy of a stock.
The 3 main zones are :
- Charging
- Charged
- Released/Trending
And unlike other indicators, the Fractal Energy Indicator is able to give the trader a deep look into what the stock is wanting to do.
As you know, trading off any indicator by itself without others is a setting up for failure, and the same goes for the Fractal Energy Indicator.
So let’s take a look at how to combine the Fractal Energy Indicator with the Bollinger Bands to give the best odds of a successful trade.
Bollinger Bands
Bollinger Bands were developed by John Bollinger as a price envelope designed to define the upper and lower price range levels of a stock.
Bollinger Band Indicator consists of a middle SMA combined with an upper and lower offset band to give the envelope the stock should stay inside, like the ropes of a boxing ring.
And because the distance between the bands is based on statistics, such as a standard deviation, they adjust to volatility swings in the underlying price.
Now how do you read these?
Bollinger Bands help to determine whether prices are high or low on a relative basis, and according to these calculations, price should fall within range 95% of the time!
Let’s take a look at an example chart on ET.
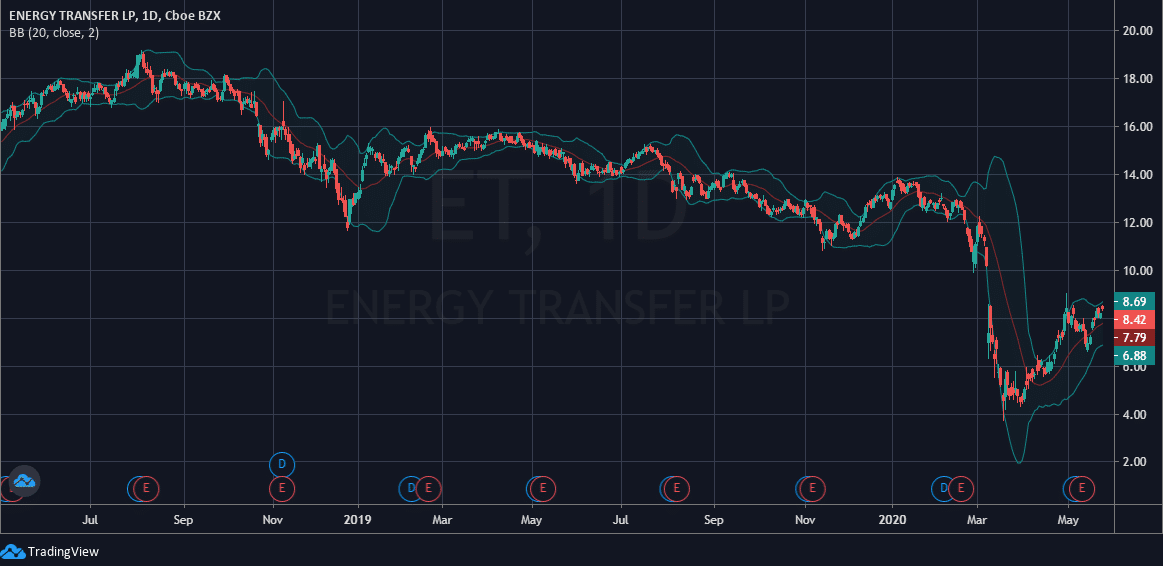
Source: TradingView
One thing you can tell is that the stock’s price falls inside the Bollinger Band nearly every trading day. It is very infrequent where the stock trades outside of the bands, but when it does it snaps right back into the range.
Cheat sheet for the Bollinger Band :
- When Bollinger Bands tighten, there is a high likelihood that price will have a sharp move
- When the bands separate by an unusually large amount, this is showing a significant increase in volatility or a gap in stock price.
- Price can hug or ride Bollinger Band prices for extended periods of time.
- Price has the tendency to bounce within the bands’ envelope, touching one band and moving back towards the other.
- You can use the middle SMA or opposite band as target prices and exits for your trading
- If prices move outside of the band, it’s expected to see a trend continuation until the price moves back inside the band.
The Trade
So this is a unique trade in that it broke out into a three-part signal.
- A trade setup
- The trade signal
- Position management and exit.
Very rarely do these types of trades happen, but they can be extremely strong when identifying correctly
First…let’s take a look at how this trade set up and got on my radar.
Trade Setup
Let’s start off by taking a look at how the indicator combined with Bollinger Bands is signaling when it’s safe to enter the markets again after the collapse.
Highlighted in green inside the bottom red box, the Fractal Energy is starting to enter a phase where the markets are getting overextended to the downside and exhausted in their momentum lower. This, combined with the Bollinger Band is starting to suggest that the prices are reaching levels that should force them to rebound back inside.
The Fractals when reading that low on their chart, also mean that it will begin to enter the regeneration phase where it gains energy before its next move.
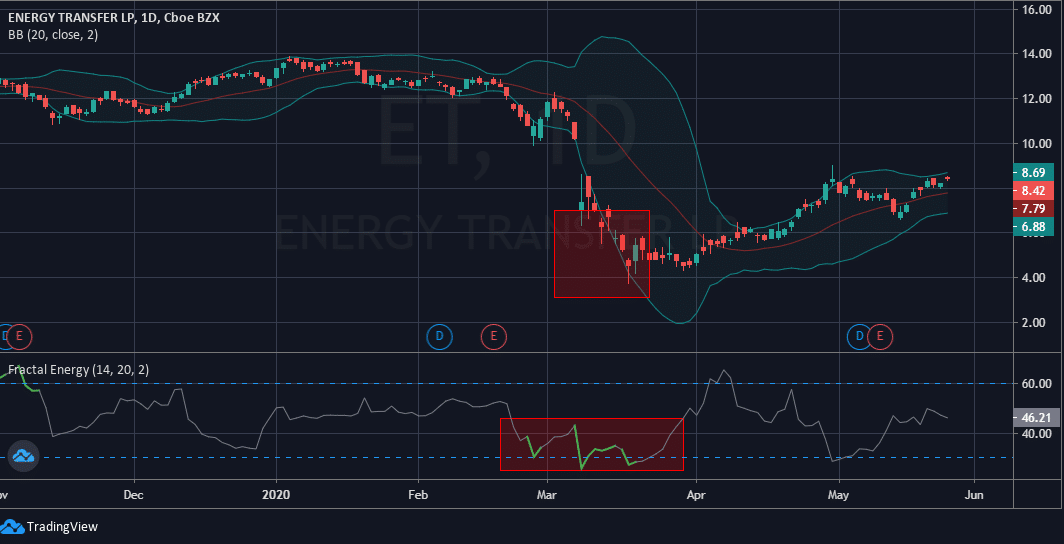
Source: TradingView
Now that we have identified that the markets are looking to find a bottom and start to regenerate the energy on the Fractal Energy Indicator, let’s take a look at the trade signal.
Next…
Trade Signal
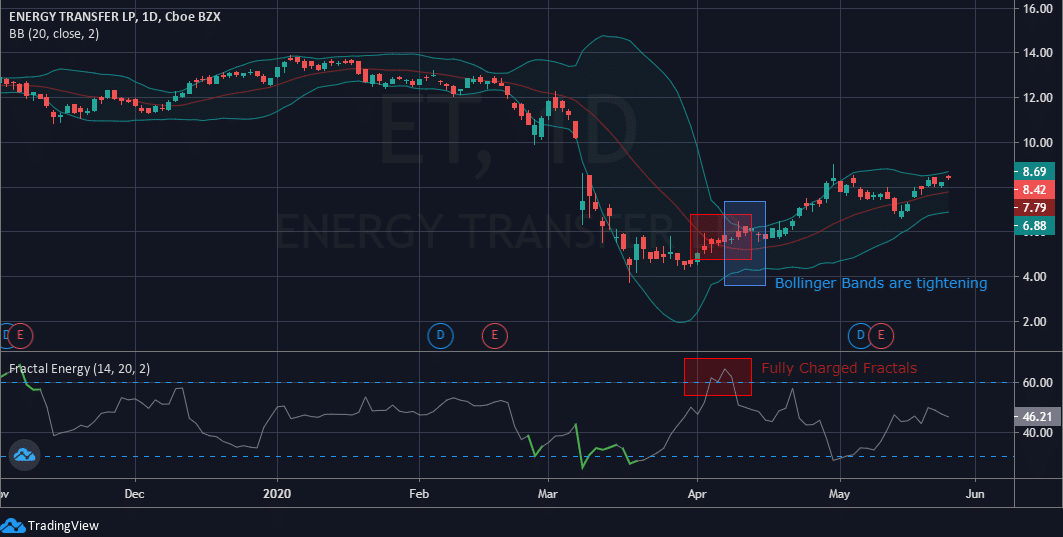
Source: TradingView
There are 2 key points that should be taken from this chart pattern.
First, the Fractal Energy is fully charged after a period of sideways market action, and the Bollinger Band prices are narrowing. These two combined with one another lead to the perfect storm, and that’s the signal to go and sell puts on ET.
The Position
The Trade: ET: I sold the Oct ’20 $4 put for $.75.
From there, it was off to the races and the stock pushed higher.
Highlighted in green is the depletion mode seen in the stock right after we entered the trade.
As the stock is depleting energy it’s continuing in the direction of the trade, slowly grinding higher as more and more of the indicator falls.
And it should fully deplete in order to recharge before making its next move.
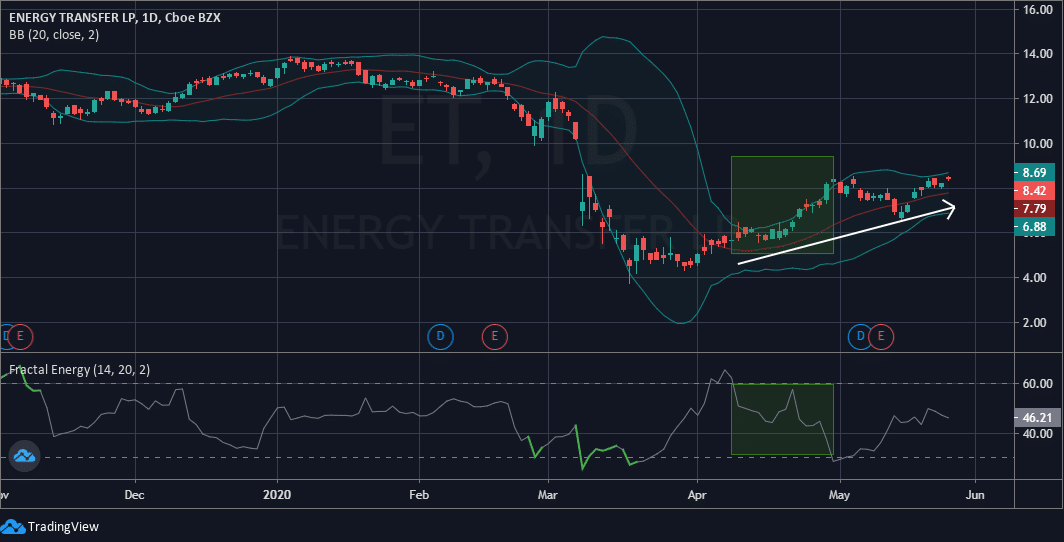
Source: TradingView
Wrapping up
Traders, the markets have staged one of the most ferocious rallies anyone has seen and is not showing any signs of slowing down anytime soon.
Unfortunately, not everybody was able to participate in the rally as buying the dip the entire way down would have been one heck of a painful strategy.
But now using the tricks of Bollinger Bands, Fractal Energy signaled exactly when this was going to happen…
And if you followed a buy signal alerted by the Fractal Energy Indicator, you got into the trade (safely, too!) at the best price while it was in the middle of a free fall.
0 Comments