Ask any option pro out there…
They’ll tell you the same thing…
When it comes to options it’s all about volatility and time decay.
Today I want to talk to you about one of my volatility indicators.
If you want to:
- Improve your entries and exits
- Set targets and stops
- And develop a better trading plan
Then this lesson is for you…
Bollinger Bands
Bollinger Bands were developed by John Bollinger as a price envelope designed to define the upper and lower price range of a stock.
Bollinger Band Indicator consists of a middle Simple Moving Average (SMA) along with an upper and lower offset band. Since the distance between the bands is based on statistics, such as a standard deviation, they adjust to volatility swings in the underlying price.
How do you read them?
Bollinger Bands help to determine whether prices are high or low on a relative basis, and according to these calculations, price should fall within range 95% of the time!
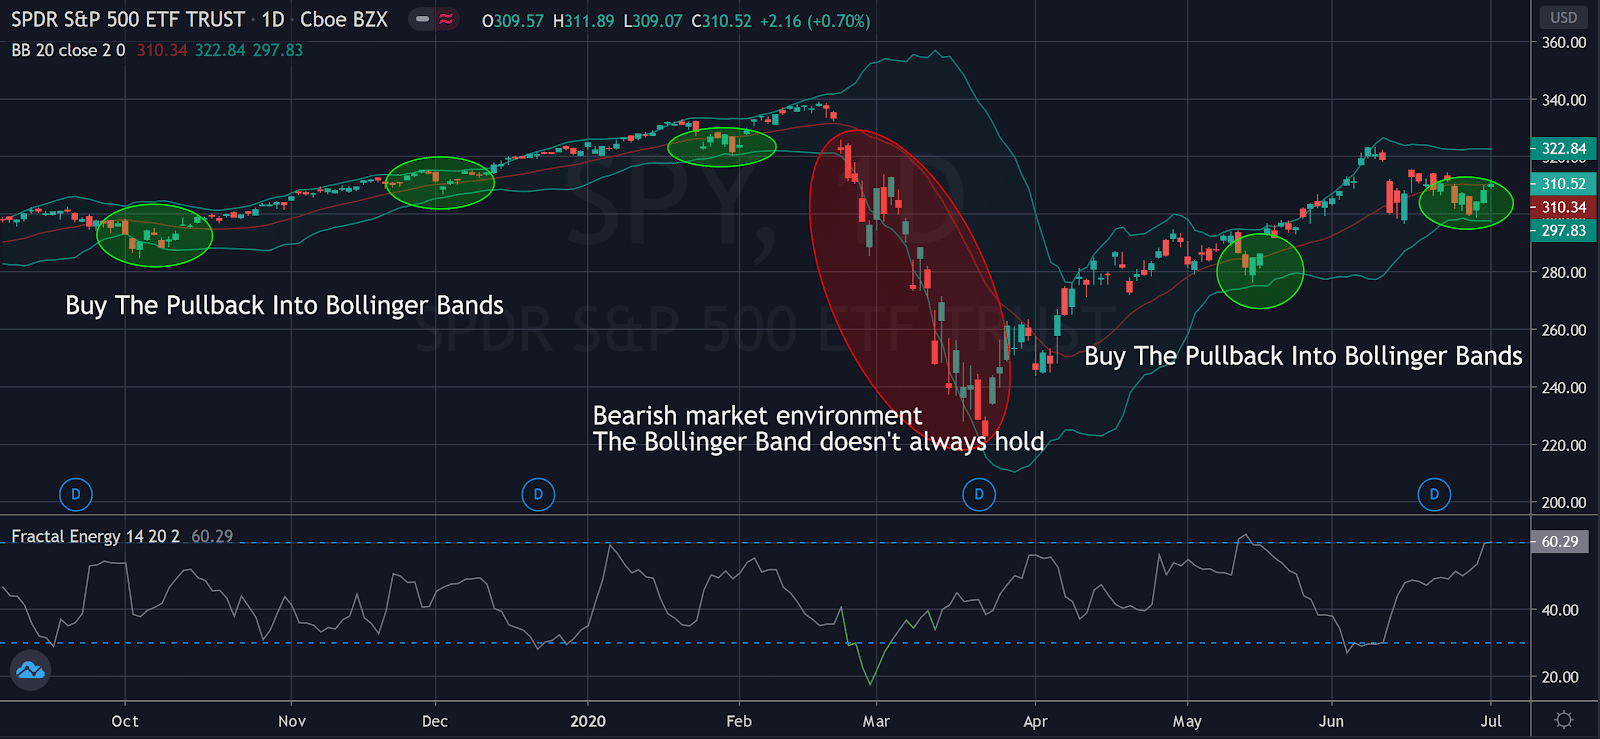
Let’s take a look at an example chart.
Source: TradingView
You may have noticed right away that price tends to fall inside the Bollinger Band nearly every single trading day with very few actually making it outside the two bands.
And if the price did trade outside of the bands, the stock made sure to rebound quickly to get back inside of it.
How this indicator works:
- When Bollinger Bands tighten, there is a high likelihood that price will have a sharp move
- When the bands separate by an unusually large amount, this is showing a significant increase in volatility or a gap in stock price.
- The stock price can exceed and even hug or ride the band price for extended periods of time.
- Price has the tendency to bounce within the bands’ envelope, touching one band and moving back towards the other.
- You can use the middle SMA or opposite band as target prices and exits for your trading
- If prices move outside of the band, it’s expected to see a trend continuation until the price moves back inside the band.
Let’s take a look at this chart closer…
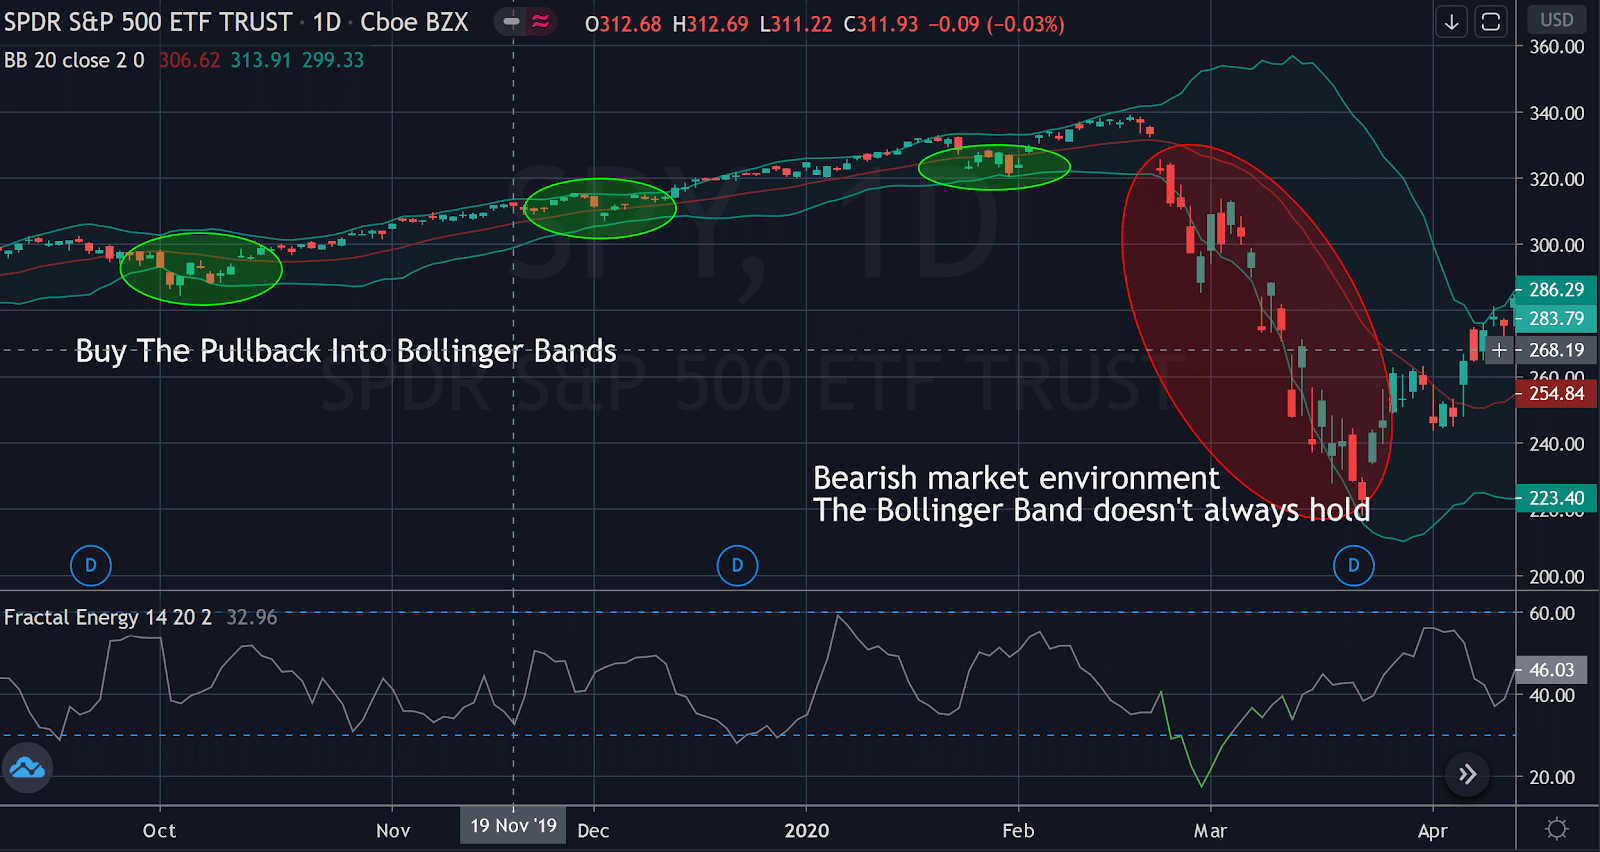
Source: Tradingview
Here you can easily see exactly the many signals the Bollinger Band will give a trader from the items that were listed above.
In a quick glance the trader will see :
- Tightening of bands leads to breakout
- Stock trends higher, riding upper band
- Trader can buy the moving average the entire way up
- Price drops suddenly below lower band and snaps back inside the next day acting as a price barrier
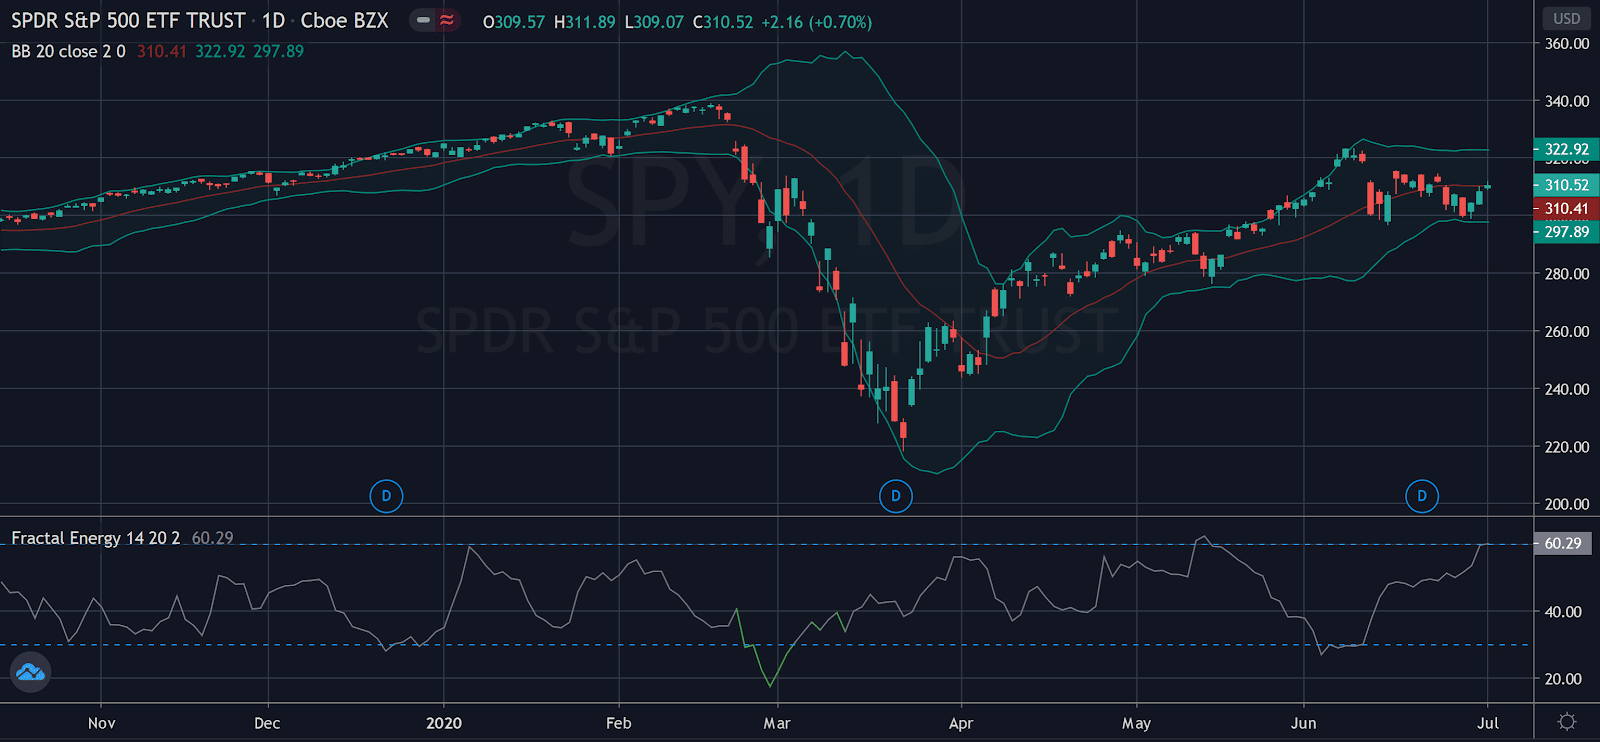
So, how does this apply to the SPY’s chart this week.
Source: Tradingview
The trade setup:
- Stock price was at or above the Bollinger Bands at the end of June
- There was a sudden reversal from the highs after riding the upper Bands
- There was slight consolidation at the center moving average
- Once lower Bollinger Band approached the stock price, it acted as support for the stock, sending it higher
Putting it all together
I know this market is crazy… you have to trust the tools you use in order to trade safely.
And those tools are the Bollinger Bands and Fractal Energy Indicator.
When they are combined, they really are one of the best strategies a trader can deploy in markets that are unpredictable.
When looking at these two indicators, this is where statistics and probability really shine and make for a highly profitable trading opportunity. And to make it even better, I combine selling options and spreads to put the house odds in my favor for every trade!
Which means not only do I trade using two battle-tested indicators, I combine these with a credit trading options strategy that can pay me 100% ROI on my trade if timed correctly to the markets.
So… to recap what makes this trade:
- The Options sellers always have statistical advantages over buyers. That’s a built-in feature for the entire options market, regardless of calls or puts.
- Bollinger Bands act as both support and resistance levels for a stock
- Fractals are approaching a charged state and have built up energy for a strong move
0 Comments