We all know the market has been running hot over the last month and the last few days have been giving some of it back.
But how can traders tell when stocks have become oversold in a market selloff?
There are a number of indicators which claim to help you here.
But there is one that’s tried-and-true.
And what is this indicator saying about this market selloff?
Bollinger Bands
Bollinger Bands act as a price envelope designed to define the upper and lower price range levels of a stock.
Bollinger Band Indicator consists of a middle Simple Moving Average (SMA) along with an upper and lower offset band. Because the distance between the bands is based on statistics, such as a standard deviation, they adjust to volatility swings in the underlying price.
How do you read them?
Bollinger Bands help to determine whether prices are high or low on a relative basis, and according to these calculations, price should fall within range 95% of the time!
Just take a look at how the Bollinger Bands picked the top of the markets perfectly
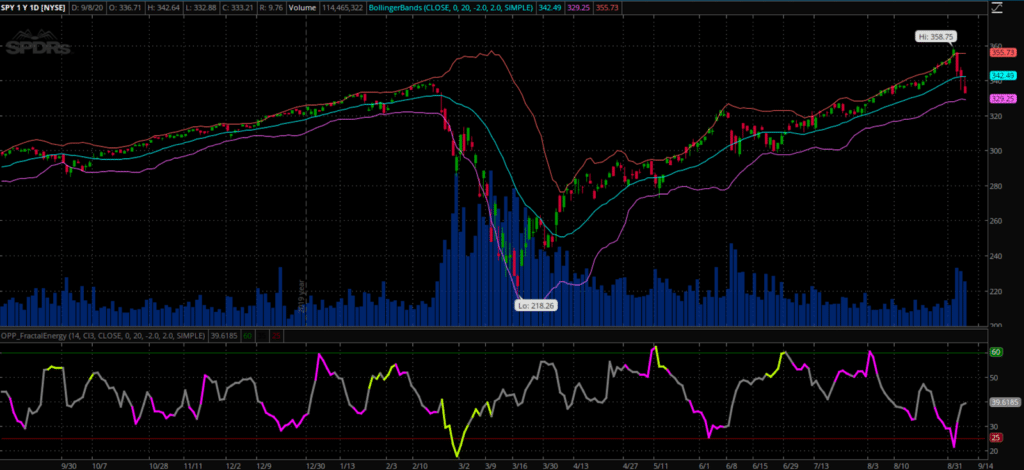
Source: Thinkorswim
But you can’t just use a single indicator and expect to be profitable in your system
Now let’s look at Fractal Energy and how the energy being exhausted in the SPY’s caused a huge selloff last week and today
Fractal Energy
As a trader, spending hours going through stock charts and looking for patterns is just part of the day in the life of a professional trader.
To cut down the work that I have to do every day, I only focus on stocks that meet qualifications set by the Fractal Energy Indicator.
When looking to understand what price action is doing you need to reference information other than a basic stock chart to get a true edge in the markets.
And by having an indicator such as the Fractal Energy indicator you can determine stocks that are charged to run or exhausted and ready to stall out.
But first – What are fractals?
The power of fractals allows me to determine the strength of trends and how much “life” is remaining in a stock’s movement.
There are 2 main components of Fractal Energy:
- Markets Fractal Pattern
- The Internal Energy
By combining those two different components you create a single indicator that is able to successfully determine the strength or weakness of a trend on any stock.
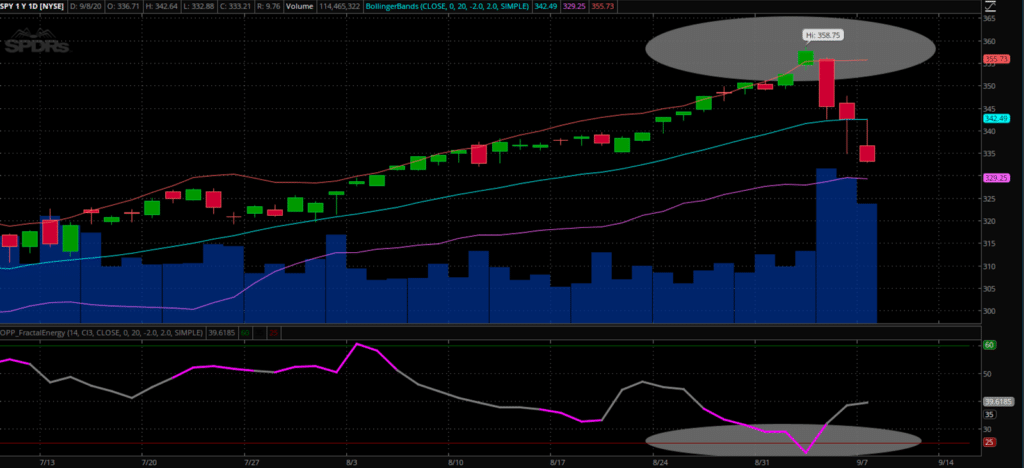
Source: Thinkorswim
Now you can go short the markets, or trade this with a unique options strategy called the Call Spread.
I prefer to stock the odds in my favor using my favorite trade, the credit call spread
The Odds Are Stacked In Our Favor
Option sellers take maximum advantage of the option time decay theory, commonly known as Theta Decay.
OTM options lose value quickly and become worthless at expiration.
We can take advantage and be the house with odds in our favor on every trade
Don’t forget that an option buyer needs to be right about direction and time!
Remember traders, there are many ways to make money in this market and selling options is one of my absolute favorite go-to strategies.
Key Points:
- Credit Put Spreads profit if the stock goes down, stays the same, or goes up
- Limited risk
- Puts the house odds in your favor
- Allows you to get paid to take risk
And you see, when it comes to placing a trade, you need to have the stock selected, with a price range identified,an indicator to show you strength of the stock, and an options strategy to tie it all together.
Fractals are the cornerstone of Options Profit Planner
When it comes to placing a trade, I always make sure there’s an edge by leveraging the power of the internal energy of a stock and pattern.
And I always make sure that I utilize a strategy of selling options or spreads to focus on generating a steady flow of income for my trading business.
But what’s extremely important to remember is that there is a strategy for both going long and short stocks that are available to you.
Plus Credit Spreads give unique advantages to traders over debit spreads, with the most important being that you are paid upfront to place a trade!
0 Comments