There is a time in a new trader’s career when they start learning about indicators.
And next thing you know, their charts turn into spaghetti from all the lines they’ve plastered on their screen.
And if you’ve tried to make a decision with so many conflicting signals— the outcome is never good.
This is when the system breaks down and makes it impossible to find any winning trades.
So what’s the solution?
A single, simple indicator that works in an up, down or sideways market is all a trader needs!
This indicator allows traders to get on the right side of the trade by tapping deep into the markets using Fractals.
And today I want to share my Fractal Energy Indicator with you and show you how to properly determine if the trade is charged or exhausted!
Fractal Energy Indicator
The Fractal Energy Indicator is a momentum indicator that measures the internal energy of a stock and plots 3 zones: Charged, Trending, and Charged zones.
Unlike RSI’s that evaluate overbought and oversold values, Fractal Energy can tap deep into the stocks internal momentum.
So let’s take a look at what these 3 readings are for The Fractal Energy Indicator.
Charged vs Overbought
When looking at a stock chart, many times a trader is just guessing at what levels to enter their trade at.
And to make it worse, there is hardly any information that a trader can reference just by looking at standard indicators.
When reading the RSI, when a value is near or over 70, a stock is considered to be overbought.
At this point, a trader would most likely remove shares of the stock they own at these levels, or execute a short trade.
And that’s exactly the opposite of what a trader should really be doing at certain key levels.
The RSI
Let’s take a closer look at a sample trade on TSLA with Overbought RSI readings.
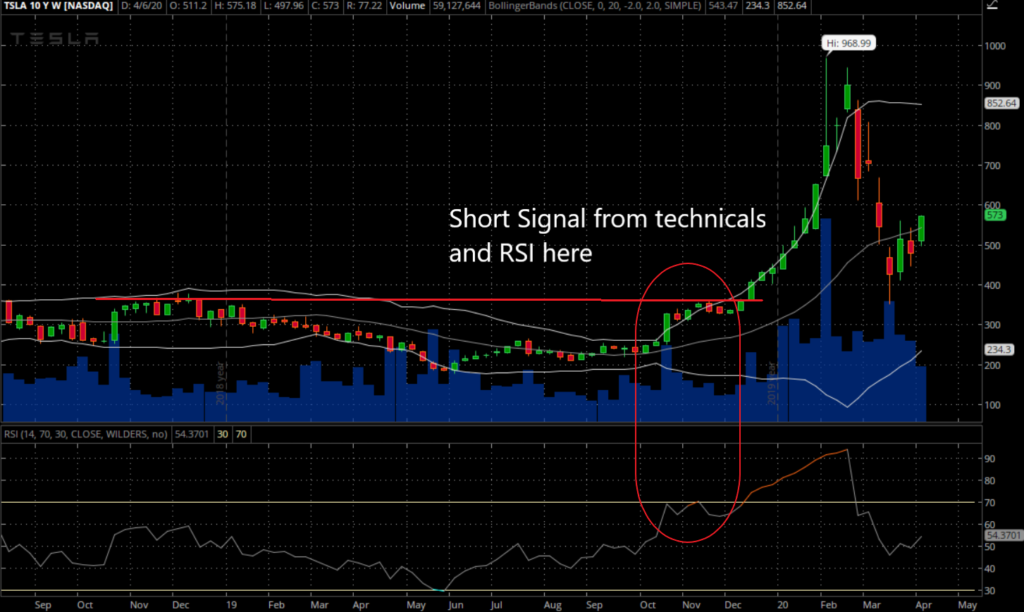
Source: Thinkorswim
According to traditional RSI strategies, if the value of the indicator was to reach overbought, the trader would look to short the stock.
And clearly looking at the chart this would have been a terrible spot to go short TSLA.
Why did this happen?
Because RSI is a simple calculation that measures the number of moves up and down to determine the ratio of up bars to down bars on a stock.
This ratio is inherently flawed as it doesn’t take into account any energy the stock might have built up going into the overbought zone.
The Fractal Energy Indicator
Now let’s take a look at how we would look to TSLA with a charged reading in the Fractal Energy Indicator.
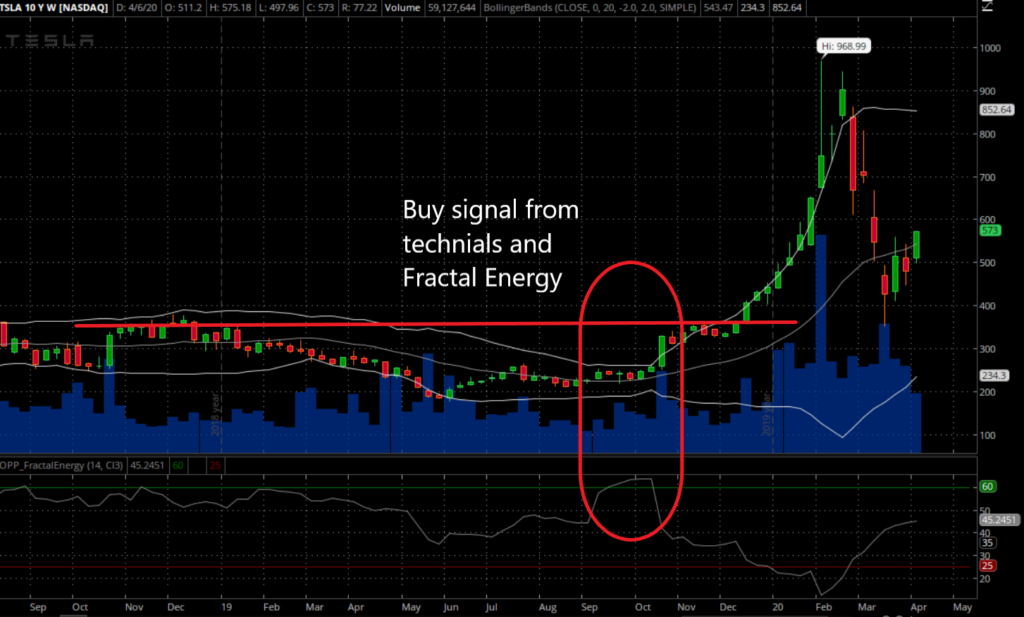
Source: Thinkorswim
According to the Fractal Energy Indicator, we would actually look to get long with a charged reading on the indicator!
And what a trade this would have been if you were able to get into it!
The Fractal Energy Indicator of TSLA at the time was the highest reading in a year! This means that the energy was more charged than usual, causing stock to erupt to the upside.
This setup sent the stock of TLSA soaring from $250/share to nearly $1000 in 6 months!
After the move, the Fractal Energy Indicator started showing the lowest reading all year, with a 12, showing the move is fully exhausted and can’t run any further.
Final Thoughts
There is a time in a new traders career when they start learning about indicators.
And next thing you know, their charts turned into a mess of indicators that resemble a bowl of spaghetti.
Has this happened to you?
If it has, the solution is a single indicator that works in an up, down, or sideways markets!
Say goodbye to cluttered charts and start focusing on a single indicator, the Fractal Energy Indicator!
This indicator allows traders to get on the right side of the trade by tapping deep into the markets using Fractals.
I am giving you the chance to take 3 trades alongside me! See for yourself the power of Fractal Energy as I am to triple my account in 3 months!
Before it’s too late, click here to find get Triple Threat now!
0 Comments