As a trader it’s common to get “tunnel vision” when you are focused on a single chart.
Before you know it, you start seeing things that you never saw before.
Chart patterns morph into shapes, and you trick yourself into seeing anything that supports your trade idea.
Some common terms you hear from technical traders are W’s V’s and L’s, h’s and U’s to name a few. It’s crazy!
The stock market is more than just patterns – it’s a function of the fear and greed of every investor.
And that’s exactly why I use math to guide my trade decisions! If you haven’t already known, fractals are a huge part of my options trading strategy!
And before you get out there and start buying or selling a stock with extreme fractal readings, you need to see how I combine multiple timeframes and multiple fractal readings to give me an A+ setup!
Options Profit Planner
Some common terms you hear from technical traders are W’s V’s and L’s, h’s and U’s to name a few. These are patterns that occur in a stock chart that resemble letters in the english alphabet to make it easier for someone to understand the price action.
Many “Double Bottoms” (or W’s) are formed because traders are all focused on the same pattern creating a herd-mentality effect to that stock. There is nothing wrong with trading this way, but it needs to be adopted for you to get an edge in.
Which is why I combine these easy to understand patterns, multiple timeframes, and my fractal energy indicator to give me an edge over the rest of the herd.
Fractal Energy Indicator
There are 2 main components of Fractal Energy:
- Markets Fractal Pattern
- Stock Internal Energy
Markets Fractal Pattern
In short, fractals are the mathematical model that explains almost everything found throughout nature.
Fractals form complex and visually appealing patterns and are used by companies to aid in their design of logos and symbols used for their company.
I bet you would have no issue identifying FORD is not a fractal pattern… but did you know that Toyotas famous inter-clocking circle logo is actually based on fractal patterns?
Stock Internal Energy
Energy is the term used to describe the stored or potential energy a stock has built up.
Like a spring that is compressed, it stores potential energy and erupts when you release the force that is keeping it held together.
The power of fractals allows me to determine the strength of trends and how much “life” is remaining in a stock’s movement.
Here’s the power of Fractals acting on the entire stock market
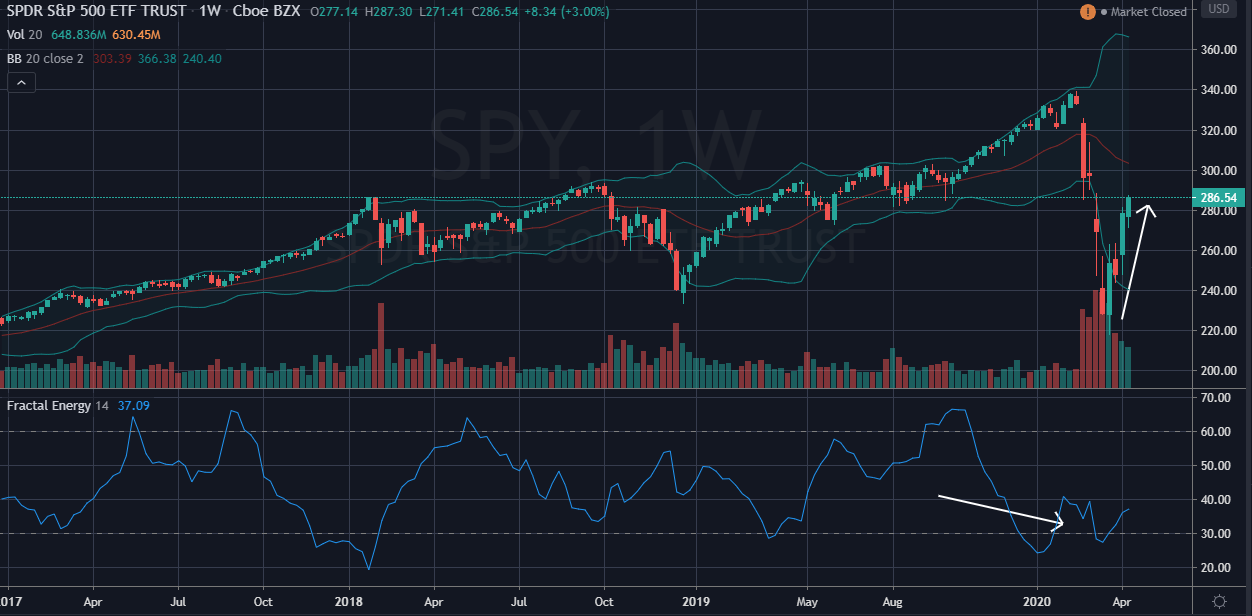
Source: Tradingview
Now, it’s not wise to buy a stock every time you see a low reading on the fractal energy indicator!
Here’s an example why you want to combine multiple timeframes with the fractal energy indicator as well.
In CMG, if we bought on the daily timeframe the first time fractals broke their lower bands, we would have been left with being stopped out of the trade.
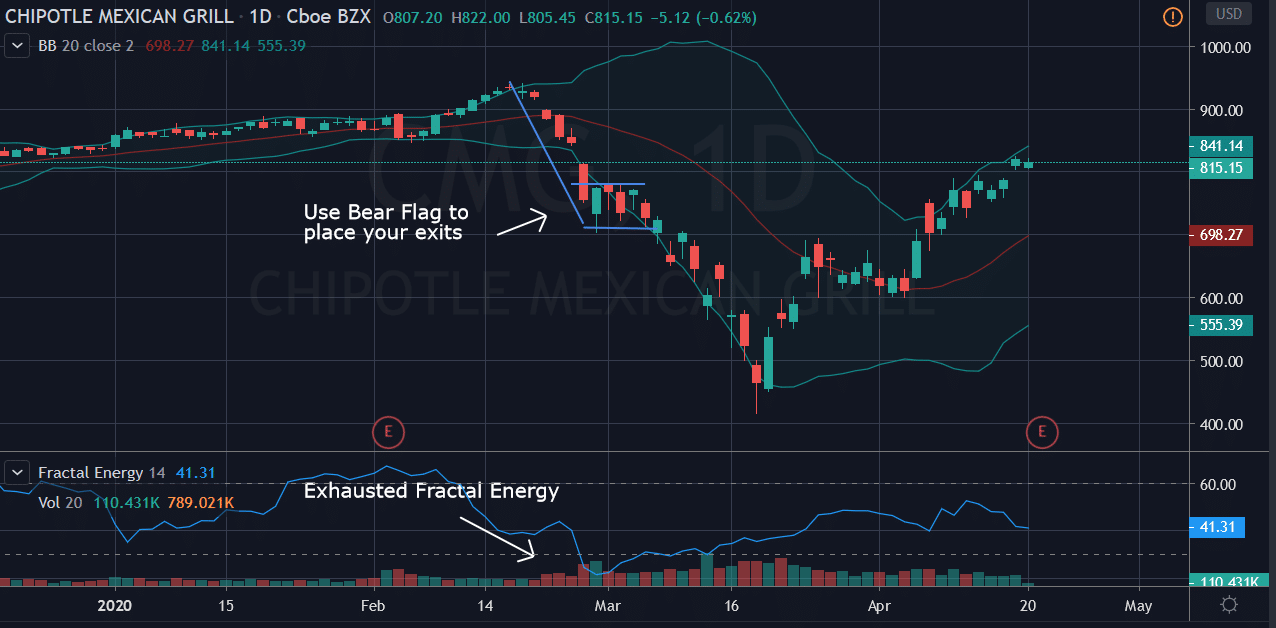
Source: Tradingview
But suppose you did in fact buy it, then it would be best to play the bear flag that was formed as your signal to exit at the break of the lower support level before the stock plunged lower.
Now, if you were to instead take a fractals approach and combine timeframes, here is what you would find.
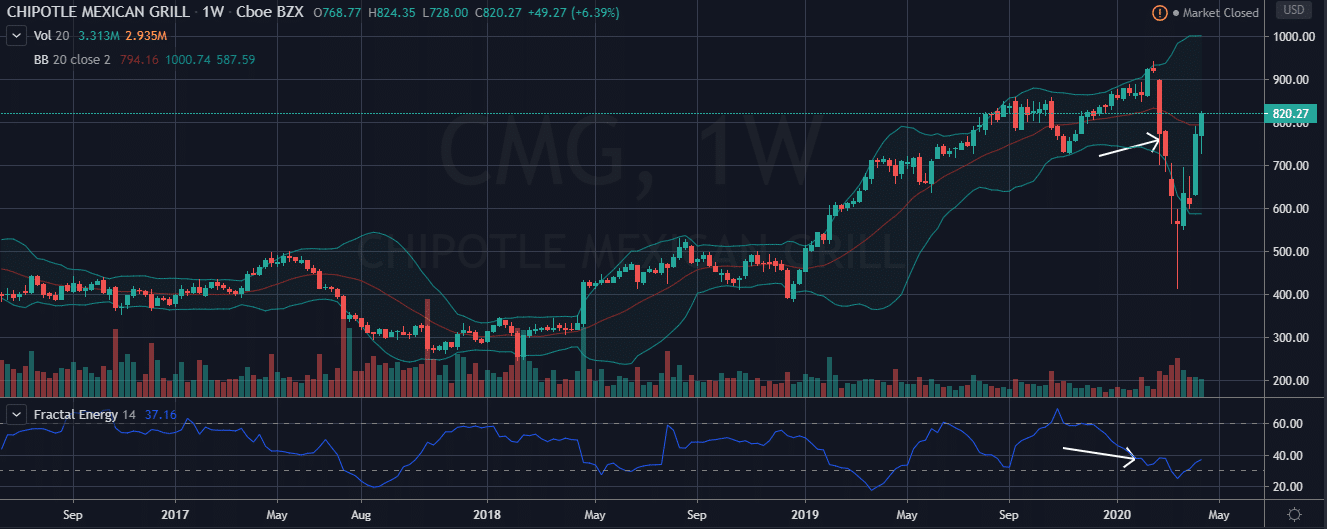
Source: Tradingview
You were actually buying on a weak candle and the fractal energy was not yet depleted yet!
And without the support of the higher timeframe to make the price rally, you ended up buying into a stock that kept falling.
Now if you were to wait for fractals to show totally exhausted readings and combined that with a horizontal support level you were able to pick that “V” bottom almost perfectly!
Here’s what I mean…
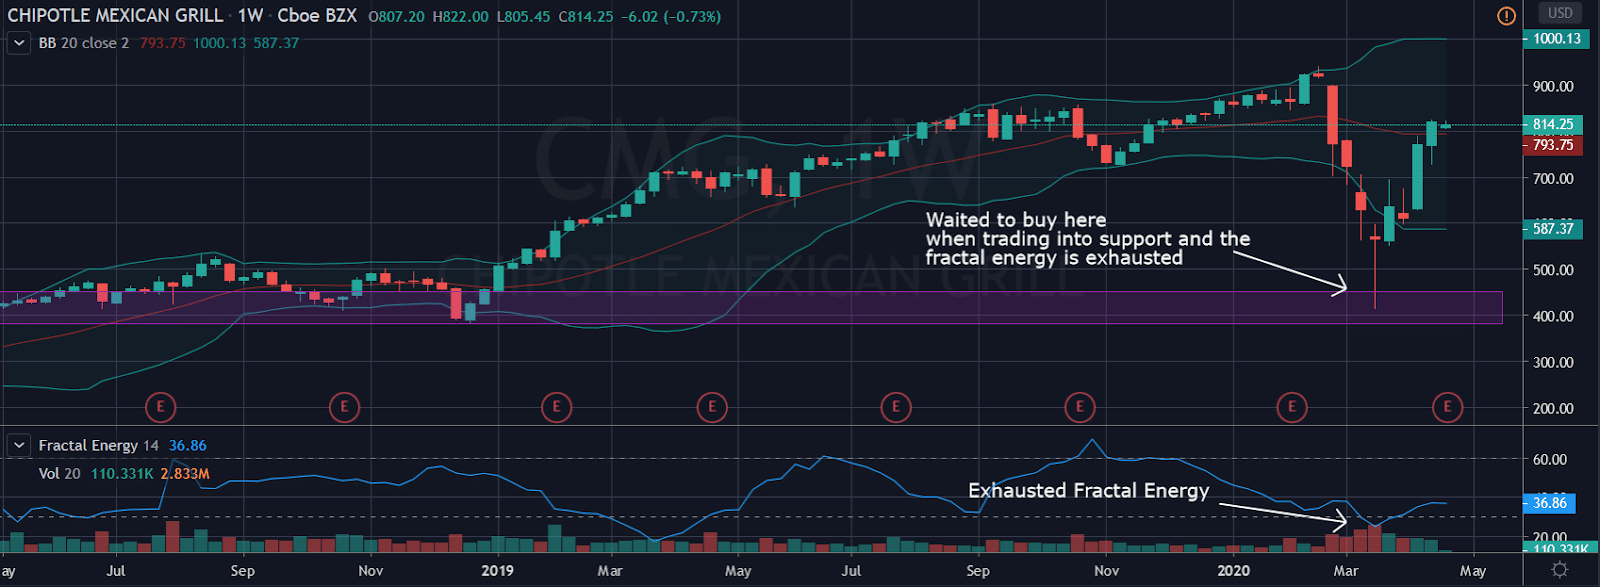
Source: Tradingview
Now that the higher time frame has exhausted fractal energy, combined with horizaontal support levels, CMG decided to bounce and head up again!
So, even though a single indicator said to buy a stock, it is best to look for confirmation signals by combining fractals with known patterns and other technical analysis techniques.
Let’s review how to use technical patterns to increase the odds of success in the trade.
Technical Analysis
Technical analysis and chart patterns are tools used by traders to help with identifying the price action a stock is currently trading in.
Each pattern has a bullish or bullish viewpoint that traders use to identify a direction to trade in.
The Double Bottom
For example, let’s take a look at the famous 52-week lows. Everyone has heard about stocks trading at 52-week lows and generally are considered to be “weak” or bearish when it comes to an investment.
Even though it’s common that many investors use the 52-week low to reference weak stock, as a technical trader, I actually consider this to be a bullish pattern instead.
Now, let’s take a look at what a double button as a 52-week low pattern
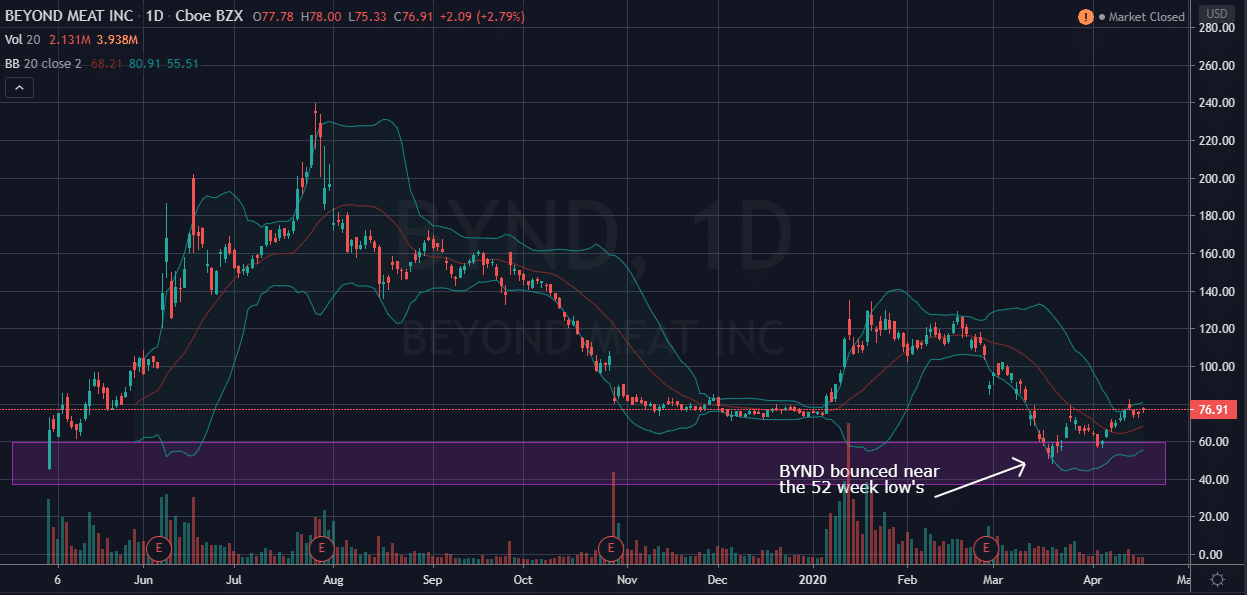
Source: Tradingview
As expected, the stock hit its 52-week low and immediately started to head higher.
Let’s take a look at another example of a 52-week low that was spotted on Amazon and see how the stock price reacted.
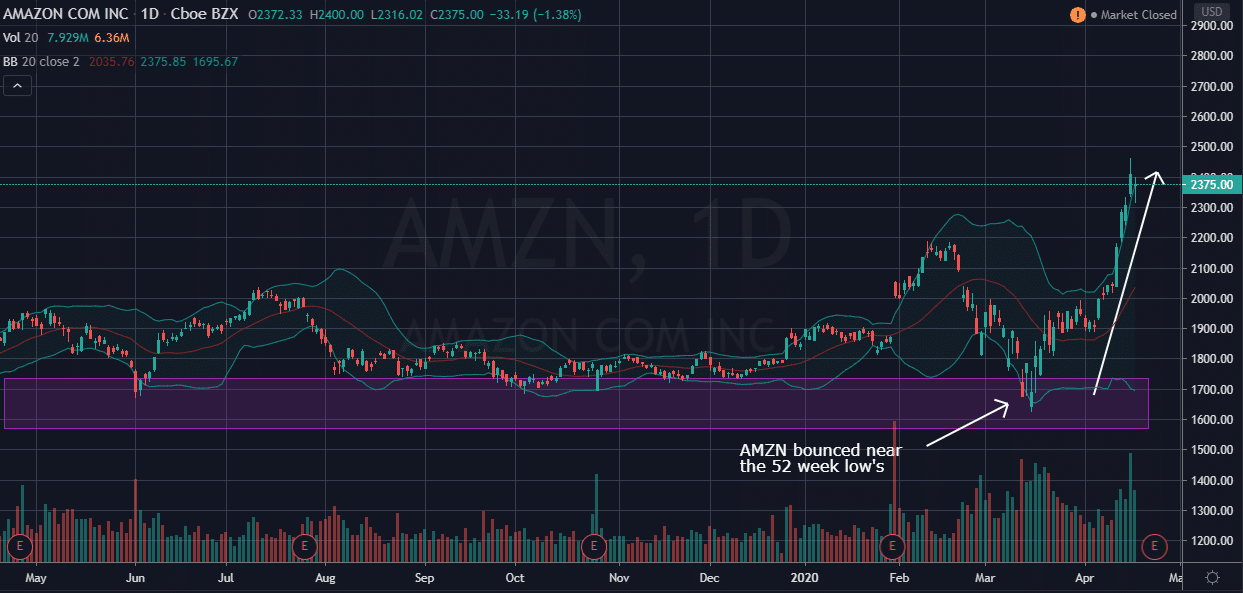
Source: Tradingview
And as expected – another huge winning trade on a stock that bounced right at the 52-week lows!
So, as a technical trader this is a pattern that I keep an eye out for as a BULLISH pattern and not a BEARISH pattern.
What’s so special about a 52-week low anyway? Well it’s a technical pattern and this happens to occur throughout the stock market, time and time again as traders look for patterns to buy stock.
Pro tip: Make sure you get out if the 52-week doesn’t support the price. Without a price floor to find support, the stock will continue to fall and it’s difficult to find the next area of support.
Multiple Timeframes
Fractal trading on multiple timeframes is a concept that many technical traders ignore because they don’t realize timeframes can influence their trades.
For example, a trader plans to go short a stock on a 5-minute breakout lower. This trade seems perfectly acceptable on a 5 minute chart, but when the 1-hour chart is referenced, it’s showing a double bottom pattern formed that a trader might not be aware of.
This is the traders tunnel vision that new traders get into trouble and end up losing money on the trade.
Multiple timeframe analysis with fractals have two main components:
- Reference higher chart time frame to arrive at a bigger picture awareness of the security in question (i.e.) to determine the direction and strength of longer-term trend.
- Traders may then look to a lower chart time frame to find entry and exit triggers for their trade.
Along with using higher and lower time frames for timing a trade, another aspect to fractals is their ability to cause patterns to “nest” inside one another.
For example, you might get a V bottom on a daily timeframe and a W bottom on a 1 hour timeframe. It is common to also have this occur with bull flags, triangles and other technical patterns.
Now let’s take a look at CMG and how patterns are found on multiple timeframes.
CMG on the Daily timeframe:
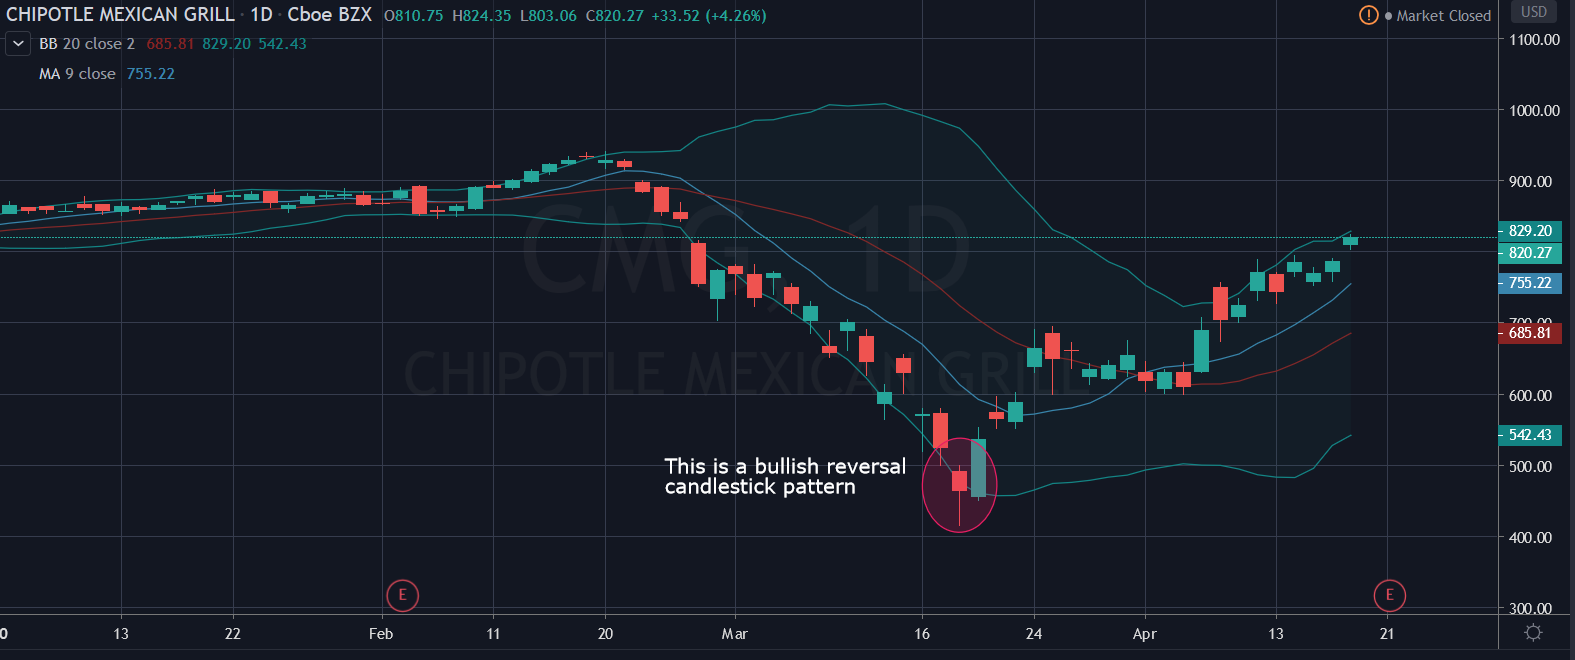
Source: Tradingview
The candle at the bottom of the market collapse was one of the few bullish candlestick patterns. Let’s take a look at what the intraday price action looked like.
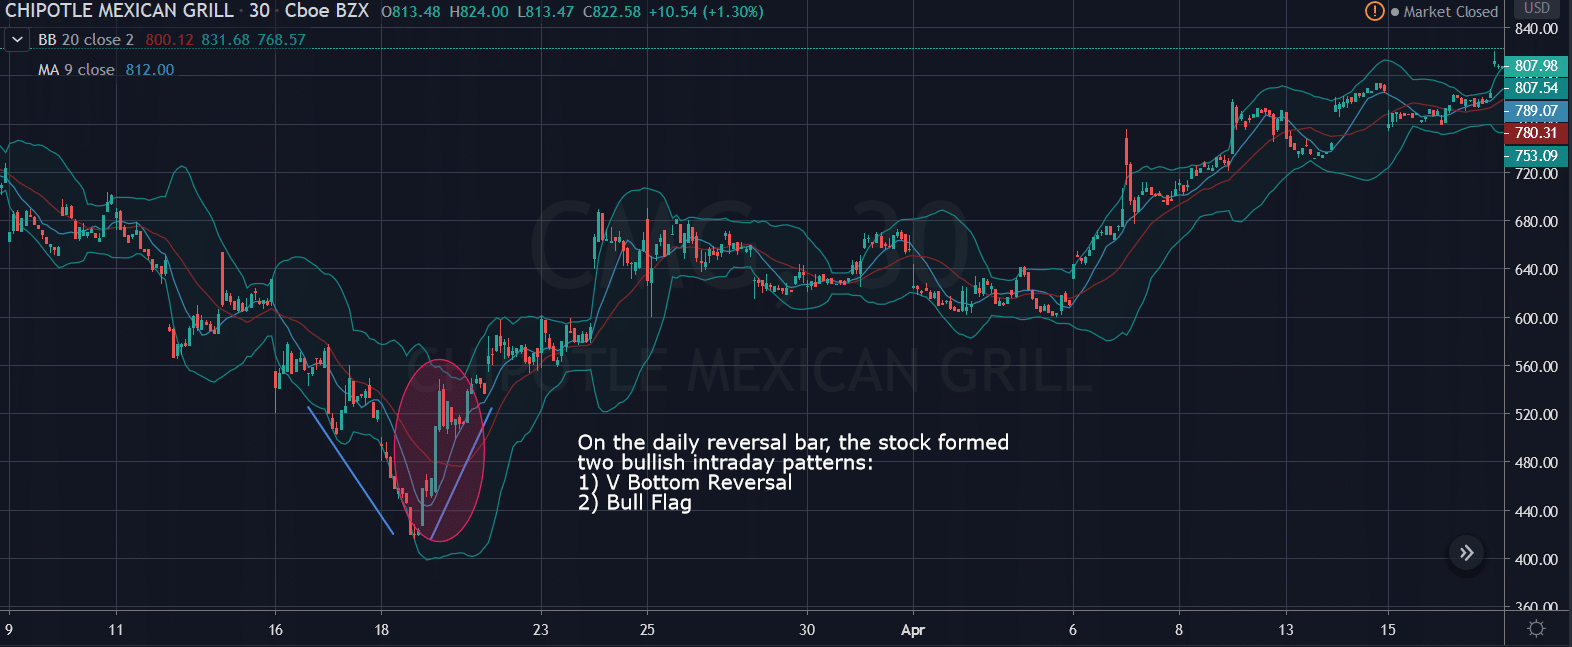
Source: Tradingview
In this example, there were 2 intraday patterns that formed the daily reversal bar, the strong reversal pattern, and a bull flag continuation.
Wrapping Up
As a trader it’s common to get “tunnel vision” when you are focused on a single chart.
Before you know it, you start seeing things that you never saw before. Chart patterns morph into shapes, and you trick yourself into seeing anything that supports your trade idea.
But if you use these tips to your advantage you can get an advantage and head start trading on some of the markets largest moves.
If you kept an eye on the markets for fractal patterns, the trade in CMG rallied 50% from the breakout levels on fractal buy signals.
So don’t miss out as the Fractal Energy indicator continues to pick trades just like this every week!
Click here to sign up to Options Profit Planner now!
0 Comments