We all know the market has been running hot over the last month.
No one can deny that.
But how can traders tell when stocks have become overbought or extended?
There are a number of indicators which claim to help you here.
But there is one that’s tried-and-true.
You can apply it to help better time your entries and exits.
And today you’re going to learn about one of my favorite volatility indicators and how I utilize it to structure my options trades for some insane results.
Bollinger Bands
Bollinger Bands were developed by John Bollinger as a price envelope designed to define the upper and lower price range levels of a stock.
Bollinger Band Indicator consists of a middle Simple Moving Average (SMA) along with an upper and lower offset band. Because the distance between the bands is based on statistics, such as a standard deviation, they adjust to volatility swings in the underlying price.
How do you read them?
Bollinger Bands help to determine whether prices are high or low on a relative basis, and according to these calculations, price should fall within range 95% of the time!
Let’s take a look at an example chart.
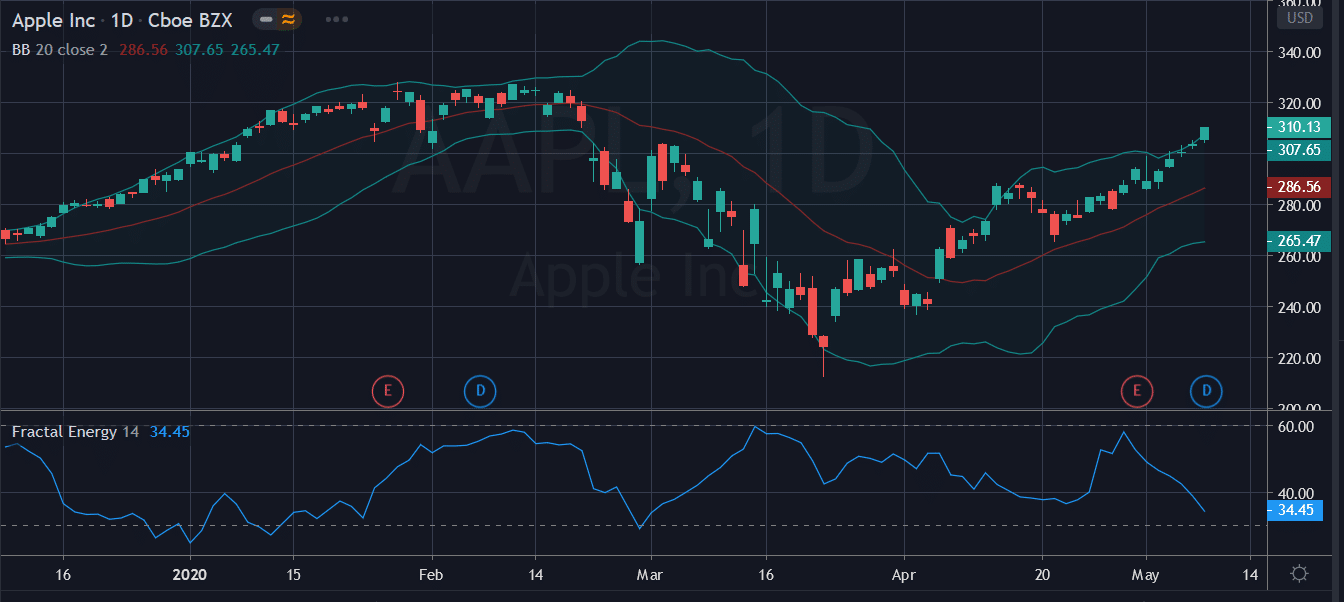
Source: Tradingview
You may have noticed right away that price tends to fall inside the Bollinger Band nearly every single trading day with very few actually making it outside the two bands.
And if the price did trade outside of the bands, the stock made sure to rebound quickly to get back inside of it.
How this indicator works:
- When Bollinger Bands tighten, there is a high likelihood that price will have a sharp move
- When the bands separate by an unusually large amount, this is showing a significant increase in volatility or a gap in stock price.
- The stock price can exceed and even hug or ride the band price for extended periods of time.
- Price has the tendency to bounce within the bands’ envelope, touching one band and moving back towards the other.
- You can use the middle SMA or opposite band as target prices and exits for your trading
- If prices move outside of the band, it’s expected to see a trend continuation until the price moves back inside the band.
Let’s take a look at this chart closer…
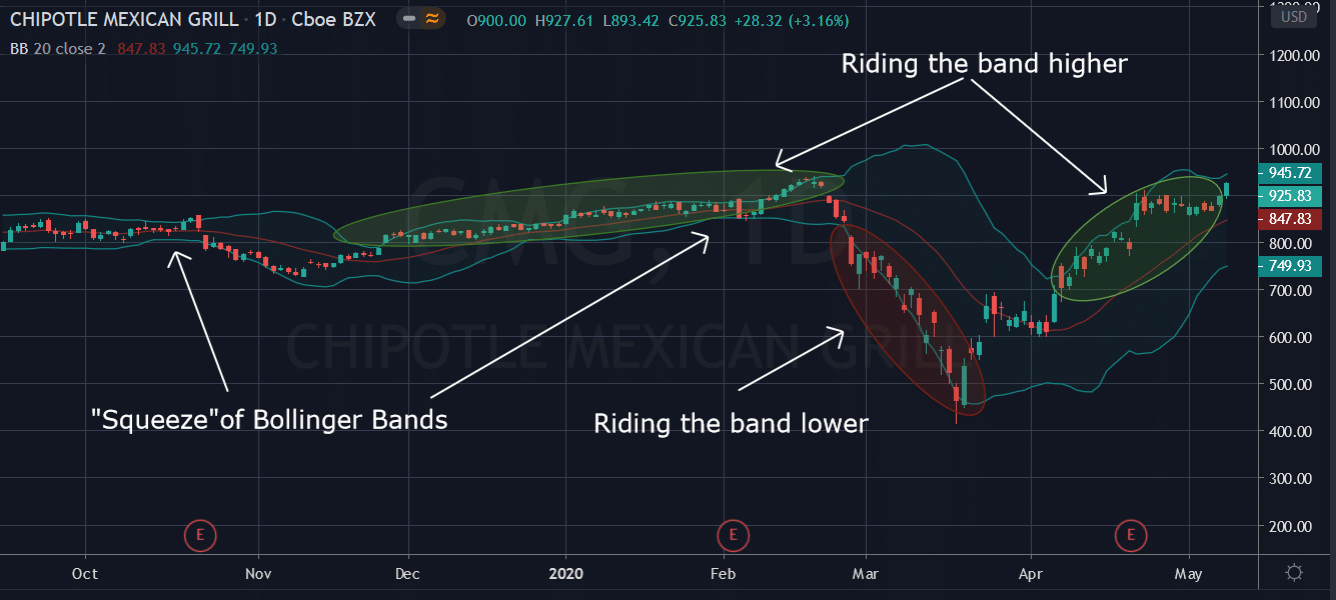
Source: Tradingview
Here you can easily see exactly the many signals the Bollinger Band will give a trader from the items that were listed above.
In a quick glance the trader will see :
- Tightening of bands leads to breakout
- Stock trends higher, riding upper band
- Trader can buy the moving average the entire way up
- Price drops suddenly below lower band and snaps back inside the next day acting as a price barrier
So, how does this apply to my trading?
Let’s review the trade OMF that was taken last week.
Placing your trade
Let’s take a look at my most recent profitable trade, OMF, and how I used this indicator.
Here’s what I saw:
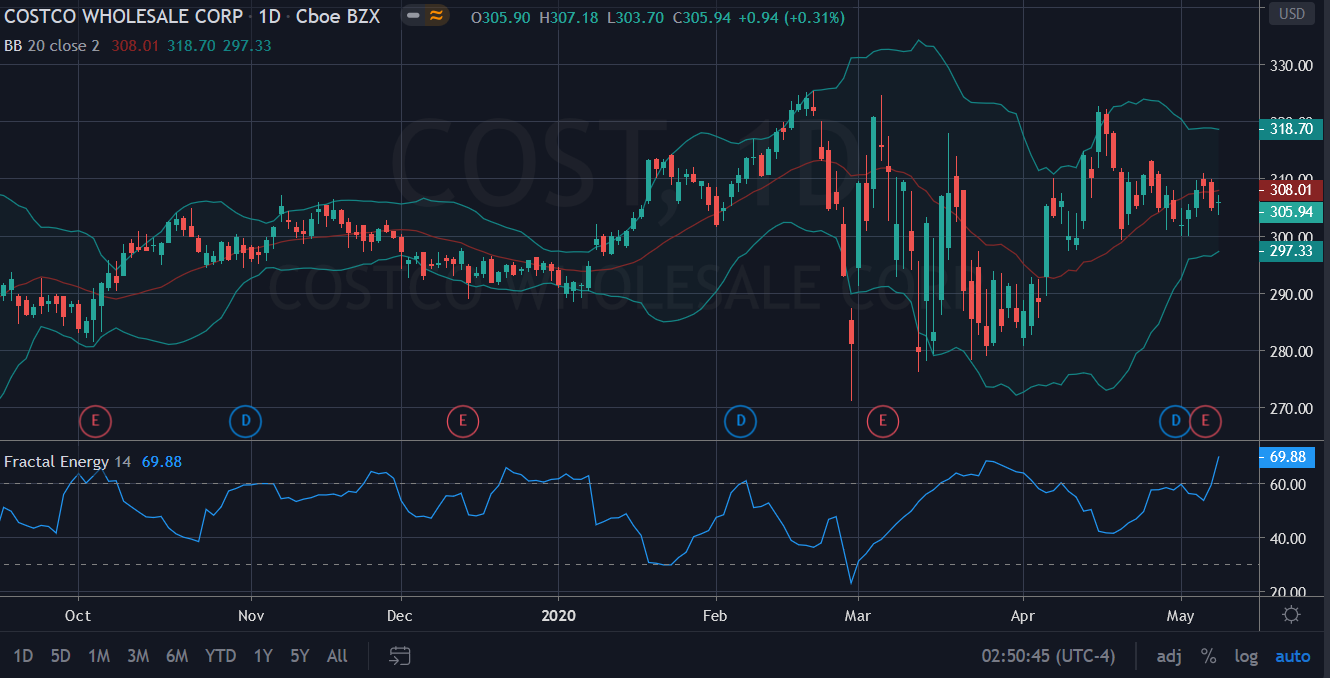
Source: Tradingview
The trade setup:
- Stock price was above the Bollinger Bands at the end of April
- There was a bullish inverted hammer that formed underneath the bands in March
- There was a lot of price consolidation at that price level.
- The Fractal Energy indicator signaled it was charged up and ready to move
As a stock slowly grinds higher, I don’t want to buy the underlying stock as it ties up too much capital and I don’t get paid for my risk.
The same reasoning applies to buying call options as well, there is just no upfront payment to take this trade.
Now with selling puts, I am able to still participate in a bullish trade and get paid to do so!
A put credit spread involves selling one put option at a strike below the current price and buying a put option at a lower strike price. Both options will have the same expiration.
When you trade this strategy you will receive a credit up front for taking this position. The maximum profits you can make on this trade is the credit you received when the stock trades above the upper strike at expiration.
The maximum loss on this trade is calculated by the distance between strikes minus the credit received.
Here is a sample trade…
COST: I sold the Oct ’20 $240/230 put spread for $1.25
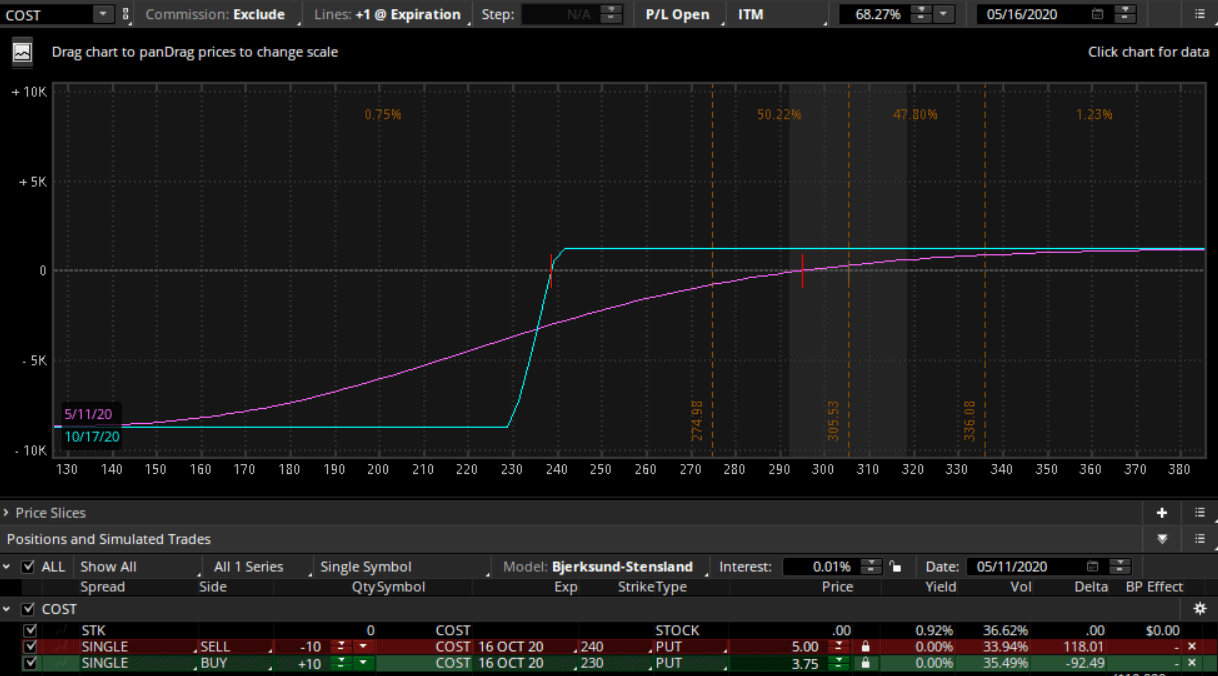
Source: Thinkorswim
Trade Details:
- Sell $240 puts
- Buy $230 puts
- Total Credit :1.25
- Total Loss : 8.75
Pro Tip: If the Bollinger Bands drag the price higher, and faster than usual, it’s easy to see a 50% or more ROI on the trade quickly. This is due to the bands having the price snap back in suddenly over a short period.
Putting it all together
I know this market is crazy… and even overwhelming to many. But you have to trust the tools that everyone uses to trade safely.
And two of those tools are the Bollinger Bands and the Credit Put Spread. When they are combined, they really are one of the best strategies a trader can deploy in markets that are unpredictable.
When looking at these two strategies combined, this really is where statistics and probability really shine and make for a highly profitable trading opportunity.
Not only do I trade using an indicator that tells me 95% of the time price will stay inside a range, I also combine it with an options strategy that can pay me 100% ROI on my trade if timed correctly to the markets.
So… to recap what makes this trade a really high probability winner.
- The Options sellers always have statistical advantages over buyers. That’s a built-in feature for the entire options market, regardless of calls or puts.
- Trading credit spreads can pay me 100% returns, which cannot be done when buying calls or even the stock outright.
- Lastly, combining a proven indicator into my trading system that when signals a stock is oversold both statistically and on the charts. Remember, there is a 95% chance it will head higher and not lower.
Click here to learn how I use the Bollinger Bands weekly to determine the market direction
0 Comments