If you ask most pros, what they want to see in the market the most…
They will tell you it’s volatility…
The reason why they prefer markets which are selling off…
Is because the moves are larger and faster…
It’s hard to profit when stocks just slow-grind up…
Do your strategies only work under certain market conditions?
Believe it or not…
My Fractal Energy indicator...saw the move in Hertz (HTZ) coming…
Can Fractal Energy reveal the warning signs of a bankruptcy?
And if so… can it keep you on the right side of a trade.
Let me show you where we picked up on the early signs of trouble in HTZ…
Options Profit Planner
Many traders spend hours hunting trading opportunities by looking at charts and patterns they see in the markets.
But this is really only a two-dimensional analysis of what’s going on in the markets. Most technical analysis tends to lack the research into the internal energy of a stock’s price.
It’s just a time-consuming process and that’s why many traders just take the shortcut to read charts as fast as possible.
To cut down the work that I have to do every day, I focus on stocks that meet qualifications set by the Fractal Energy Indicator.
When looking to understand what price action is doing you need to reference information other than a basic stock chart to get a true edge in the markets.
And by having an indicator such as the Fractal Energy indicator you can determine stocks that are charged to run or exhausted and ready to stall out.
What are fractals?
The power of fractals allows me to determine the strength of trends and how much “life” is remaining in a stock’s movement.
There are 2 main components of Fractal Energy:
- Markets Fractal Pattern
- The Internal Energy
By combining those two different components you create a single indicator that is able to successfully determine the strength or weakness of a trend on any stock.
Here are some recent examples of how Fractals can find critical price action in stocks to get you into a trade in advance of the larger move.
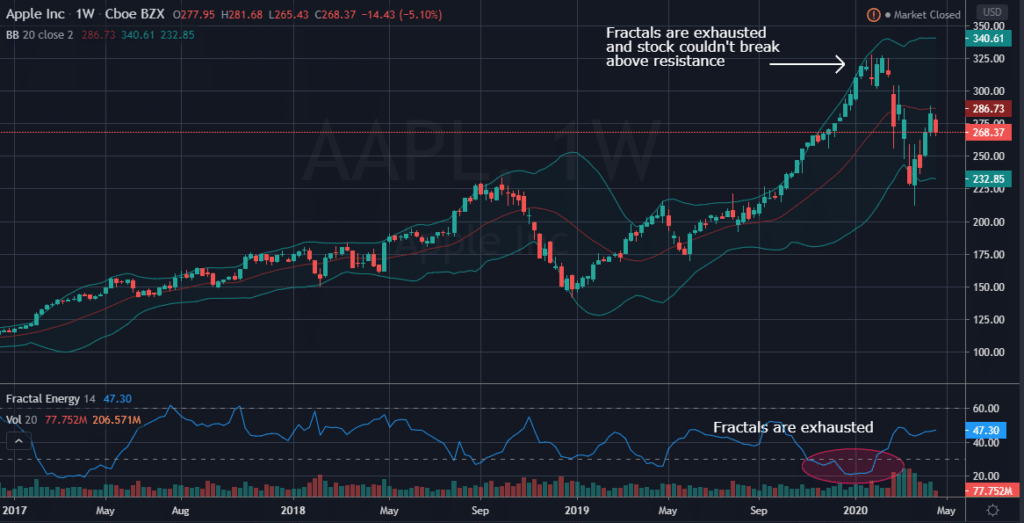
AAPL:
You can see in AAPL that once the Fractal Energy started to show signs of exhaustion, the stock started to find a top and roll over and head lower.
Source: Tradingview
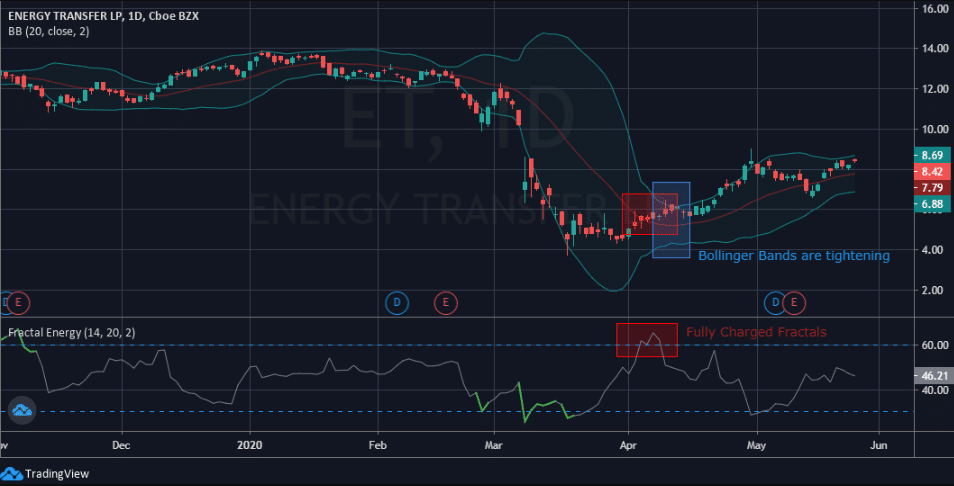
ET:
In ET, you can see that the Fractal Energy showed signs of being fully charted
Source: Tradingview
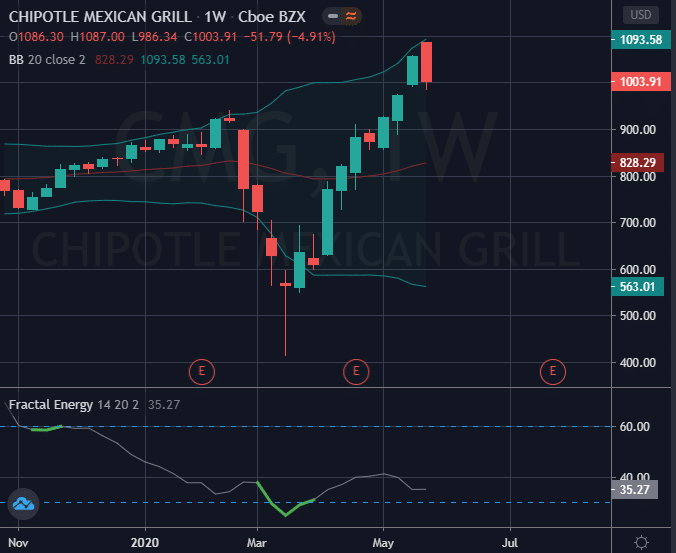
CMG:
With CMG there were multiple price action signals being given to us all around the same level.
The buy signals:
- Price was extremely sold off, extending far into the lower Bollinger Bands
- Fractals were showing total exhaustion readings under 35
- There was major buying power coming into the stock as it traded down to almost $400/share
Source: Tradingview
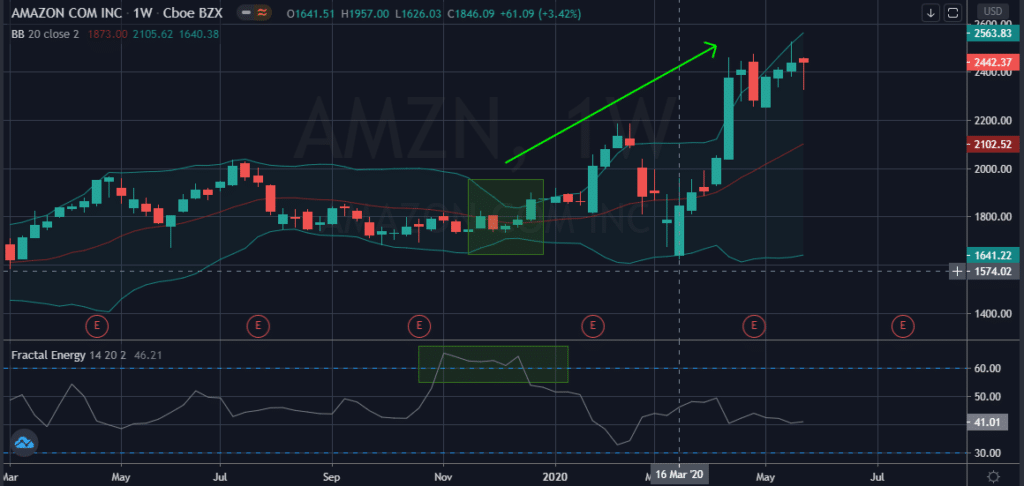
AMZN:
In the AMZN chart, we can see how Fractal Energy was able to predict explosive stock movement.
There are two stand-out buy signals that triggered this movement.
- The Bollinger Bands are the narrowest they have been in most of the year
- Fractal Energy is fully charged and showing that the stock is carrying a lot of potential fractal energy by charging for almost 3 months
Source: Tradingview
How Fractals Predicted Total Failure
As you can see, there are many reasons to focus on and trade using Fractal Energy to guide you.
Many times traders just get overwhelmed with too many indicators on their stock charts.
And when this happens you have many conflicting signals making it difficult to analyze accurately.
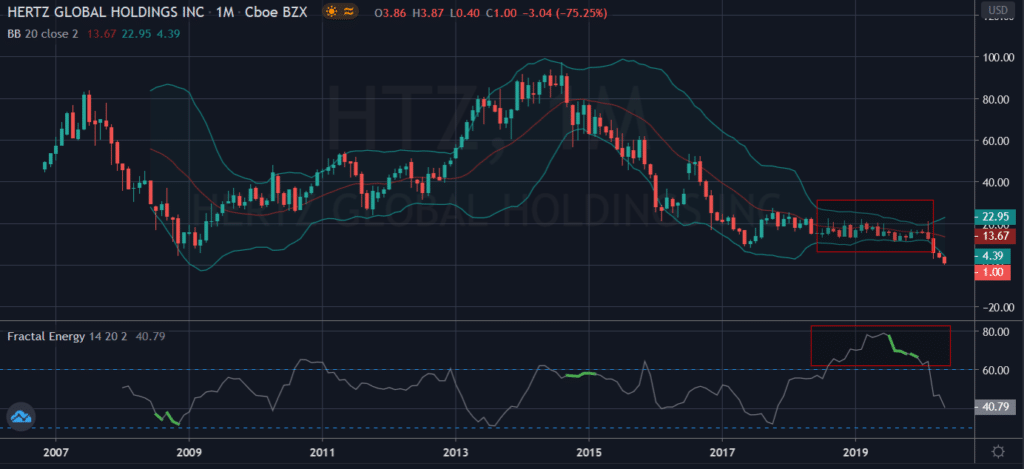
So let’s take a look at what I saw on one company’s chart that signaled massive price movement… which ultimately resulted in the bankruptcy of the stock.
Source: Tradingview
Breaking It Down
When I saw this extremely bearish pattern, I instantly was in fear of what the future was of the rental car company, Hertz.
Which is why I want to break down what I saw and why it kept me out of a trade that I typically would have taken.
52-week lows
Since 2015, HTZ has been continuously making new 52-week lows, using this technical support level doesn’t hold much weight.
Typically, when a stock touches its 52 week low, there is a period where the stock will bounce and reverse its trend.
But when stocks are extremely weak, they will ignore this technical level and trade lower to continue its trend.
Here is a chart of HTZ where it does not react to the 52-week low as expected.
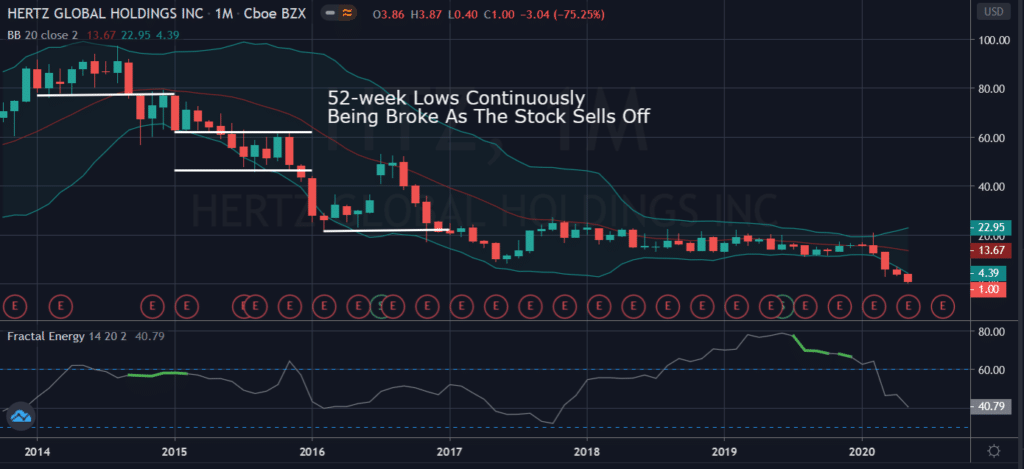
Source: Tradingview
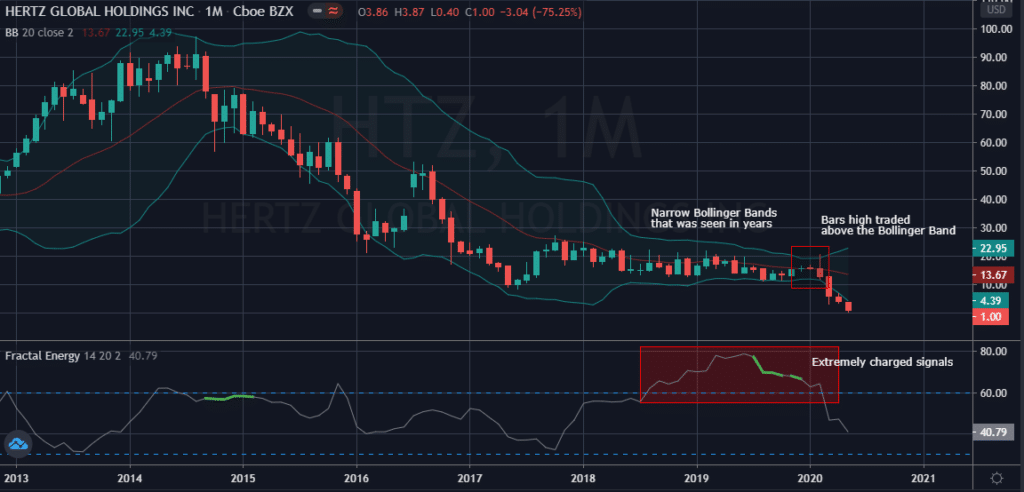
Multi-year Narrow Bollinger Band
Bollinger Bands measure two things, strength of trend and volatility.
And when a stock shows periods of consolidation, it will usually experience a sudden period of high volatility soon after.
Source: Tradingview
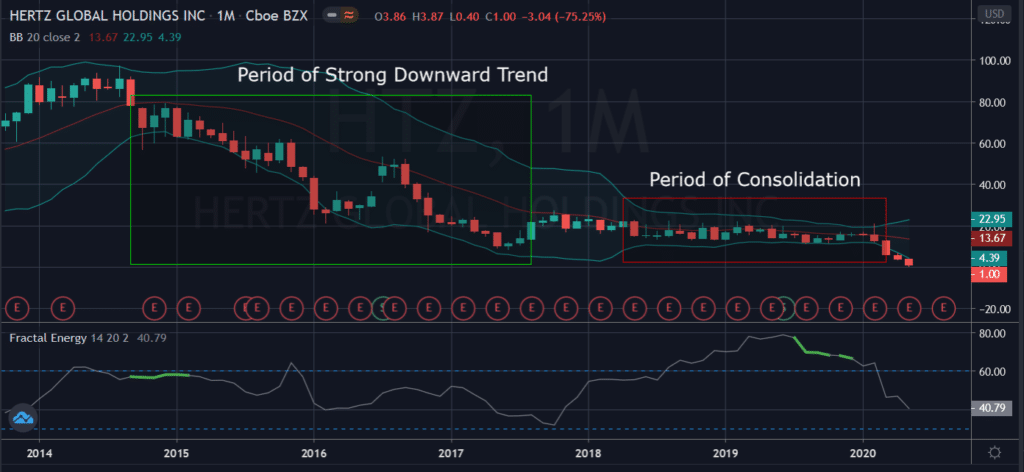
In the chart above, there were recent periods of a strong downward trend and low volatility.
And this is where things get interesting…
Fractal Energy is the highest that has been seen in the life of the stock.
Source: Tradingview
And this leads to an ominous view of the stock’s future.
With so much built-up energy during the period of the lowest volatility seen in HTZ, the outcome isn’t looking good.
Combined with the fact that the 52-week lows along with multi-year low are not supporting the stock price is suggesting that HTZ is going to be trading lower in the future as the energy is released.
And that’s exactly what happened!
Now after the dust settles, Hertz has officially gone bankrupt and it seems that the forecast provided by Fractal Energy has come true.
Wrapping Up
Many times new traders just get overwhelmed with too many indicators on their stock charts.
And when this happens you have many conflicting signals making it difficult to analyze accurately.
Which is exactly why you need only a handful of indicators to help you break down the markets and put you in a position to make money on your trades.
So as you can see, there are many reasons to focus on and trade using the Fractal Energy Indicator.
Even though there was a negative outcome for HTZ, there are many other stocks that are primed to rally through all time highs that are being signaled by the Fractal Energy Indicator.
Click here to sign up to Options Profit Planner Now
0 Comments