There are two phases of the market, calm and crazy, with very little in between.
Either you have the market timed perfectly or you run the risk of being blindsided by sudden market moves.
And recently with the markets being plunged into chaos from an unknown biological threat, nicknamed the Coronavirus, nobody knows where to turn.
One day you are up… the next you are down… and with little to slow the markets, a 1% move in under 10 minutes is the new normal right now.
I can tell you from experience that one thing is certain. You absolutely can’t panic and need to get the market direction correct before you place your trades.
So how do you do this?
It’s simple. Be sure to use a tried and true market strength indicator that tells you exactly what to expect next.
How do I do this?
I turn to my custom indicator that taps into the inner markets and Fractal Energy of the stocks.
And this indicator has nailed the market top and bottom to almost the exact day of the reversal!
Today I’m going to explain to you how it works.
Fractal energy
The Fractal Energy indicator is one of the centerpieces of the Options Profit Planner trading system.
This is one indicator that I use to determine the strength of trends and how much “life” is left in a stock’s movement.
But before I get into how to read this indicator, let’s break down exactly what this is.
It’s comprised of two parts.
- Fractals
- Energy
Fractals: Fractals are a critical component of nature and are found throughout everything from snowflakes to coast lines. These mathematical phenomenon describe patterns that recur at progressively smaller scales, and are the driving force as why a pattern works on the daily time frame all the way down to a tick time frame.
Energy: The definition of energy is the power derived from a force applied to an object. In stocks, it is the amount of buying or selling pressure exerted on the stock by the traders in the markets.
So… now that we have the basics covered let’s take a look at how to apply this to the markets.
Using fractal energy to time market moves
Recently we have seen some of the most intense volatility in the financial markets in the last 10 years.
And so far it has been kicking butt and taking names along with it.
But that’s not the case with Options Profit Planner… but instead we have been crushing the markets left and right with perfectly timed put spread trades!
Now I bet you are wondering… How could this be possible?
It’s simple!
By using the Fractal Energy indicator I’ve been able to predict the market move down and the most recent bounce almost perfectly!
Let’s take a look at SPY’s when using this indicator plotted.
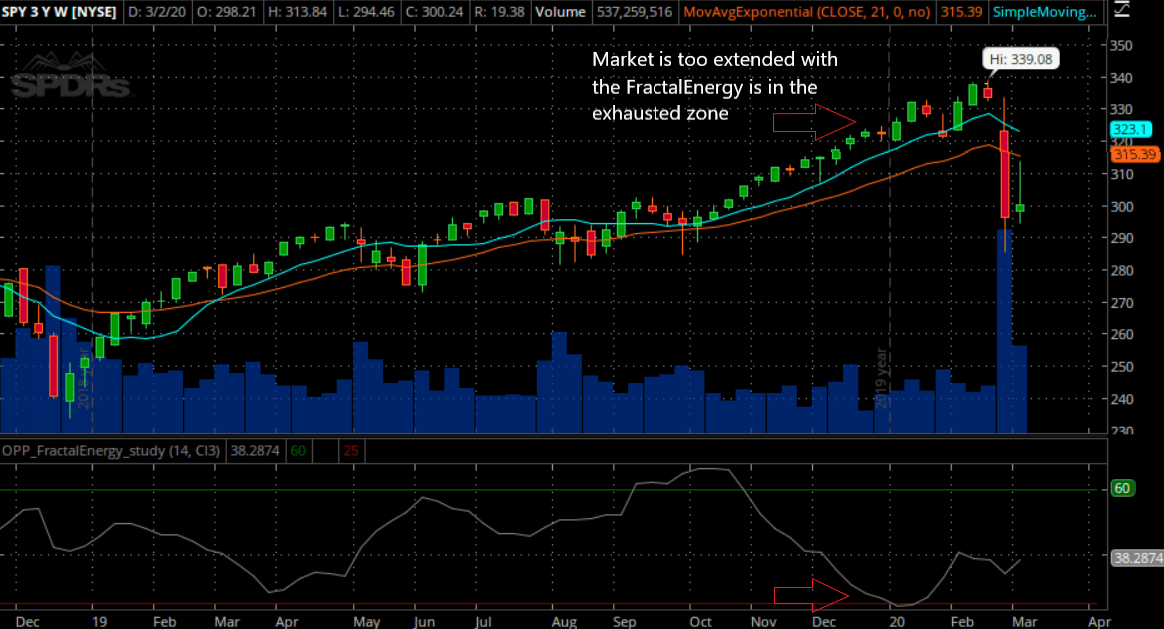
The weekly chart:
 Source: Thinkorswim
After looking at the red arrows you may notice that something stand out, the market sold off.
And why is that?
Well, when the indicator is below the red horizontal line, it is considered to be “exhausted” in its movement and needs to “recharge” it’s fractal energy in order to continue moving in the original direction.
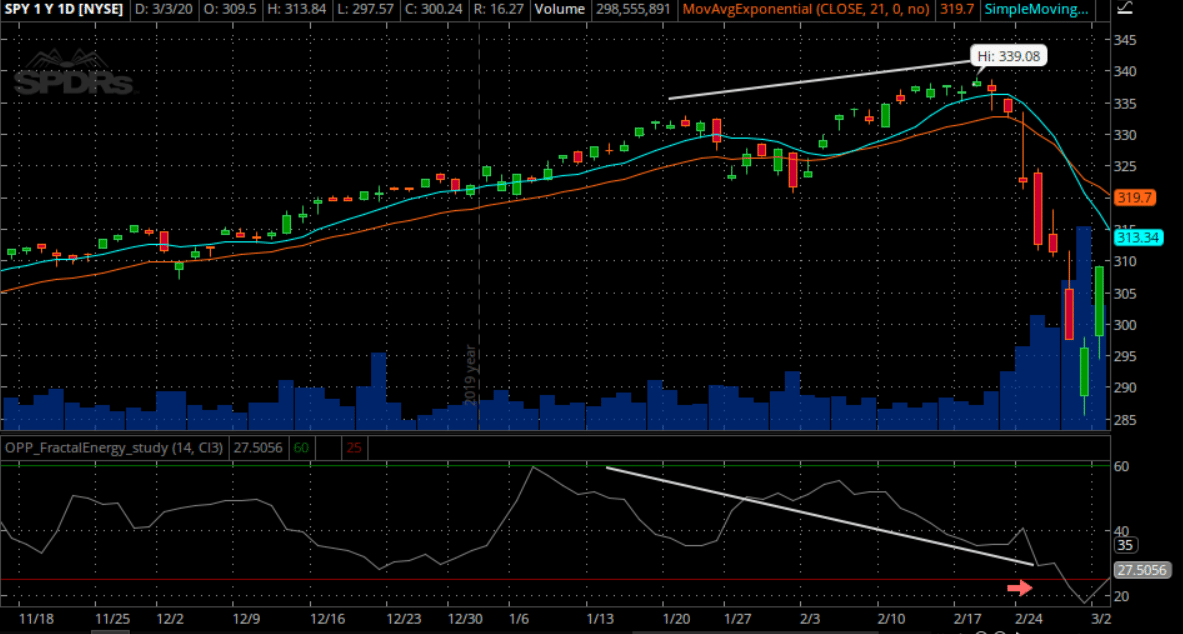
Now… let’s take a look at the Fractal Energy on the Daily time frame.
 Source: Thinkorswim
Now, the Fractals are starting to show their presence in the form of a divergence between the SPY’s and the Fractal Energy indicator on the daily time frame.
As the markets are starting to make new highs, the indicator is continuing to lose energy, driven by the weekly chart.
And the result of this was a breaking point causing the markets to head lower from any major news headlines.
And we got just that… Enter CoronaVirus…
We needed a catalyst to force the markets to move lower and a biological scare was just the right force to do so.
So… there are two trades a trader could take…
The trades
Now… if a trader wanted to take advantage of the market top there are two ways they can trade this movement.
First, they can sell naked calls, or alternatively, sell call spreads.
But as I favor selling put spreads, the better opportunity is to wait for the markets to signal they are ready to bounce higher.
This way I can take advantage of both the market direction and the increase in volatility in the options markets.
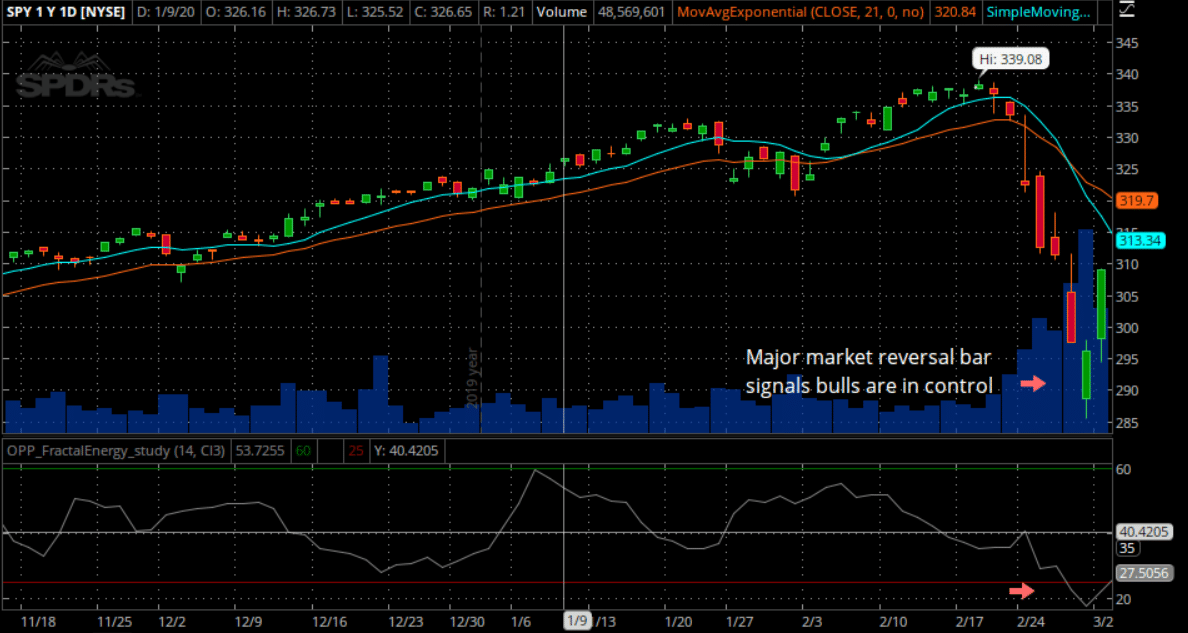
So, now looking at the Fractal Energy indicator, let’s see if it identified a turning point for the markets.
 Source: Thinkorswim
Now in this daily chart, you can see a major market move downward that corresponds to some of the lowest reading of the Fractal Energy seen in 4 months.
And this means the markets on the daily time frame are completely exhausted and ready for a bounce to generate more energy before continuing their direction.
So this is exactly what we took advantage of!
Shortly after this alert was sent, the market saw two enormous green bars rocketing off the lows which caused the options to kick up profits immediately!
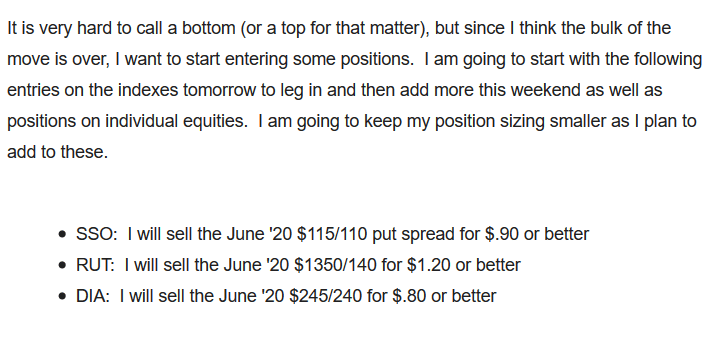
Here is the notice that members of Options Profit Planner received in their inbox as I was placing this trade last week!
Wrapping up
It’s almost unbelievable how accurate this Fractal Energy indicator is when determining strong market trends and periods of exhaustion.
But yet the Fractal Energy indicator is at it again in helping me pick the trades I should be taking and when to get in.
Don’t worry, I bet you are thinking that we only trade these on the SPY’s. The beauty of Fractal Energy is that it works on any stock and on any time frame!
Let’s take a look at an example of a stock this worked perfectly on…
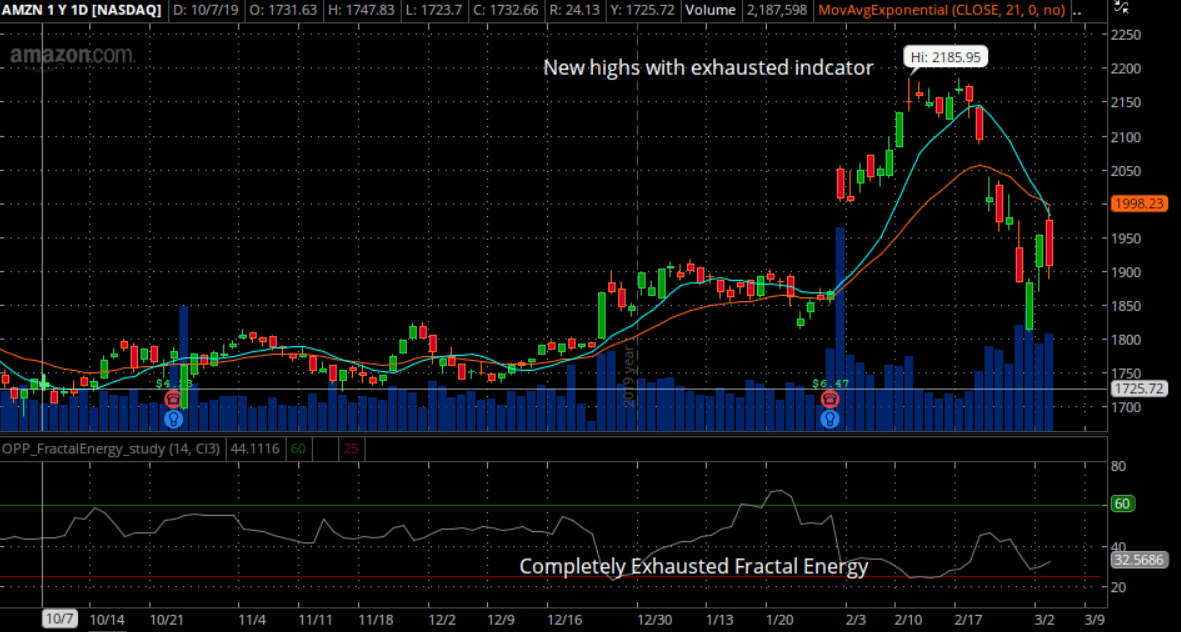 Source: Thinkorswim
Now even though I did not take this trade, here is an example of how the Fractal Energy helped to predict a major selloff in AMZN!
So are you ready to start putting the power of Fractal Energy to work for you?
0 Comments