It’s rumored that just by looking at the S&P 500 daily chart …
A professional trader can spot 100 different trading patterns.
You can make trading as complex as you want it to be.
Or you can try to keep it simple…
Which is why I analyze the SPY’s using a small set of indicators combined with Fractal Energy to narrow my focus down to what matters.
Now let’s take a look at what these indicators are saying for the SPY in the upcoming weeks
Options Profit Planner
As a trader it’s common to get “tunnel vision” when you are focused on a single chart.
Before you know it, you start seeing things that you never saw before. Chart patterns morph into shapes, and you trick yourself into seeing anything that supports your trade idea.
Some common terms you hear from technical traders are W’s V’s and L’s, h’s and U’s to name a few.
These are patterns that occur in a stock chart that resemble letters in the english alphabet to make it easier for someone to understand the price action.
Many “Double Bottoms” (or W’s) are formed because traders are all focused on the same pattern creating a herd-mentality effect to that stock.
There is nothing wrong with trading this way, but it needs to be adopted for you to get an edge in.
Which is why I combine these easy to understand patterns, multiple timeframes, and my fractal energy indicator to give me an edge over the rest of the herd.
Fractal Energy Indicator
There are 2 main components of Fractal Energy:
- Markets Fractal Pattern
- Stock Internal Energy
Markets Fractal Pattern
In short, fractals are the mathematical model that explains almost everything found throughout nature.
Fractals form complex and visually appealing patterns and are used by companies to aid in their design of logos and symbols used for their company.
I bet you would have no issue identifying FORD is not a fractal pattern… but did you know that Toyotas famous inter-clocking circle logo is actually based on fractal patterns?
Internal Energy
Energy is the term used to describe the stored or potential energy a stock has built up.
Like a spring that is compressed, it stores potential energy and erupts when you release the force that is keeping it held together.
The power of fractals allows me to determine the strength of trends and how much “life” is remaining in a stock’s movement.
Here’s the power of Fractals acting on the RUT on the daily chart.
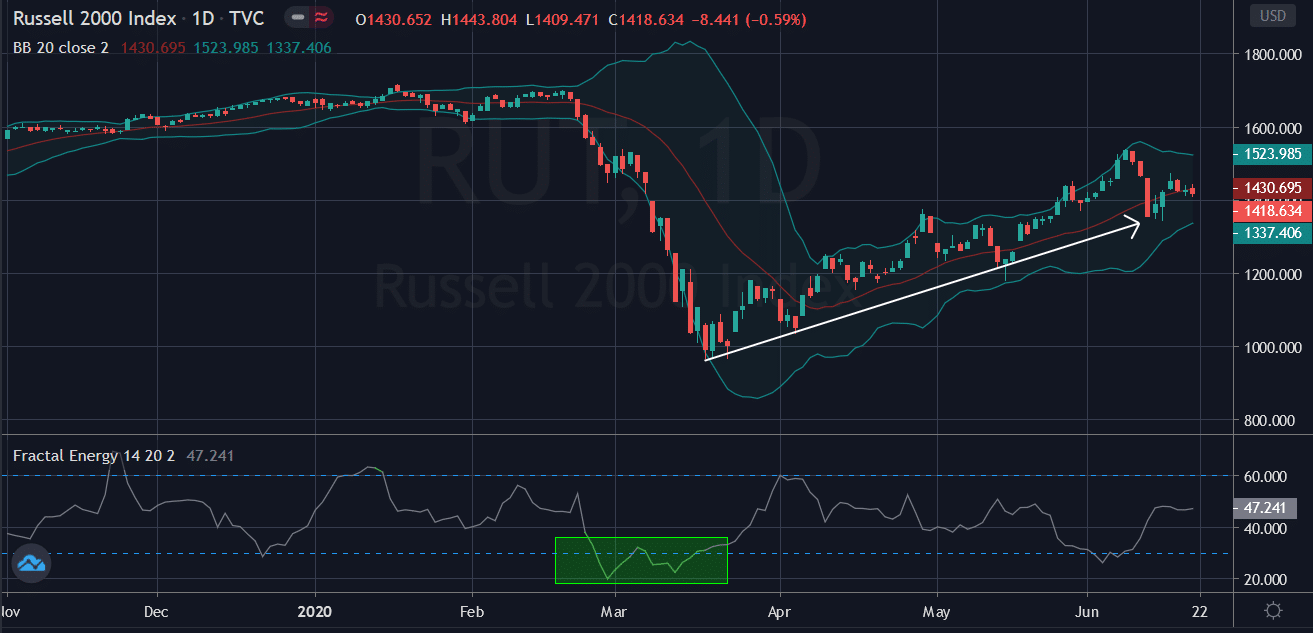
Source: Tradingview
And when you look at the next time frame higher, the pattern becomes even clearer to see…
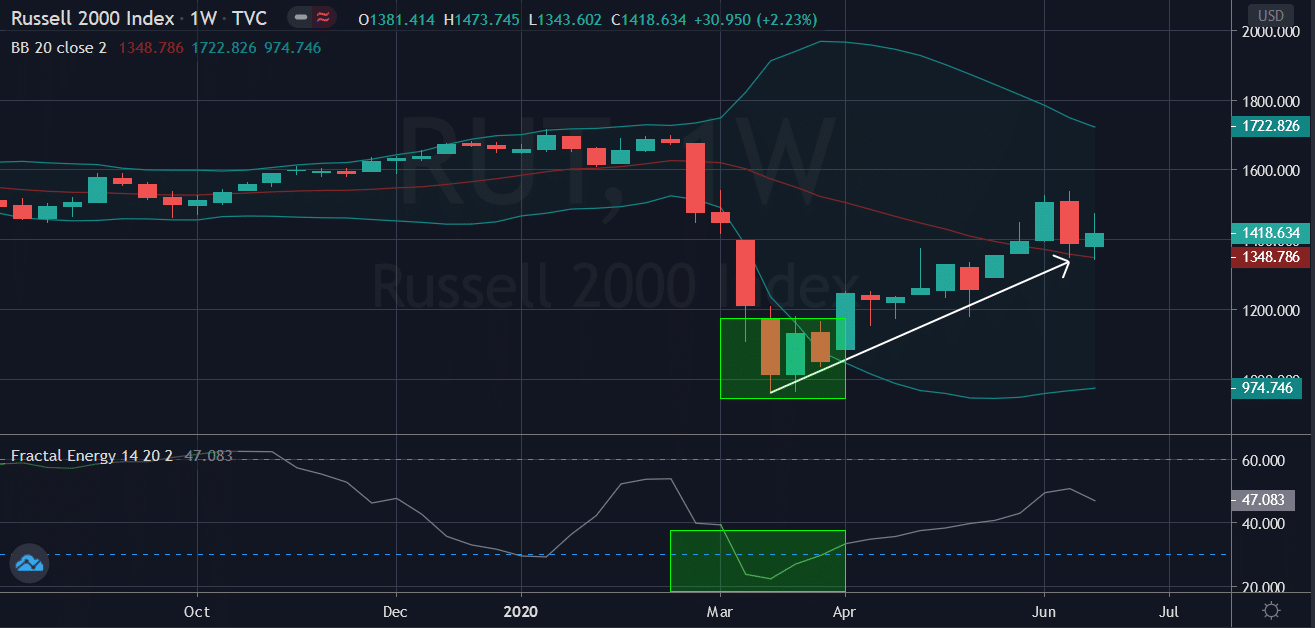
Source: Tradingview
Once you get multiple time frames aligning, the signal becomes far stronger than a single time frame by itself.
So… let’s look at what Multiple Time Frame Analysis means for a trader.
Multiple Timeframes
Fractal trading on multiple timeframes is a concept that many technical traders ignore because they don’t realise timeframes can influence their trades.
For example, a trader plans to go short a stock on a daily breakout higher.
At first, this trade seems perfectly acceptable on a Daily chart…
But it’s only when the weekly chart is referenced, it’s showing a double top pattern formed that a trader might not be aware of.
This is the traders tunnel vision that new traders get into trouble and end up losing money on the trade.
Multiple timeframe analysis with fractals have two main components:
- Reference higher chart time frame to arrive at a bigger picture awareness of the security in question. i.e.) to determine the direction and strength of longer-term trend
- Traders may then look to a lower chart time frame to find entry and exit triggers for their trade.
Along with using higher and lower time frames for timing a trade, another aspect to fractals is their ability to cause patterns to “nest” inside one another.
Pro Tip: You might get a V bottom on a daily timeframe and a W bottom on a 1 hour timeframe. It is common to also have this occur with bull flags, triangles and other technical patterns.
The SPY’s
Now let’s apply this same logic to the SPY’s today.
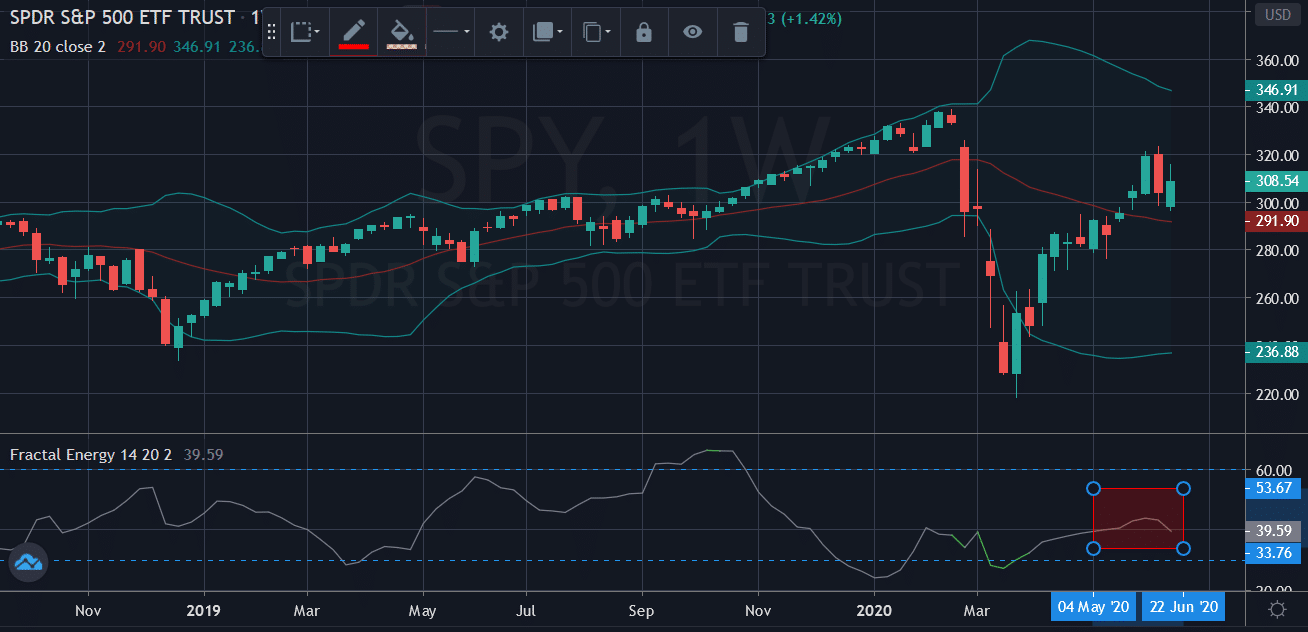
Here is a chart of the S&P 500 for reference.

Source: Tradingview
The daily chart of the SP500 is showing that the SPY’s are getting ready for a period of sideways consolidation.
Why?
Well, the SPY is trading in the middle of the Bollinger Bands and the Fractal Energy is only registering a middle value for it’s trending signals.
This means the markets are likely to head sideways to negative while the fractals recharge.
Now let’s go up a timeframe to the weekly chart
Source: Tradingview
On the weekly, the pattern is about the same.
We are seeing a slightly negative dip in the Fractal Energy combined with the SPY trading near the middle of it’s range on the Bollinger Band.
This means it could be likely that the stock heads sideways from here as it continues to gain momentum in either direction.
Let’s take a look at the monthly chart of the SPY next.
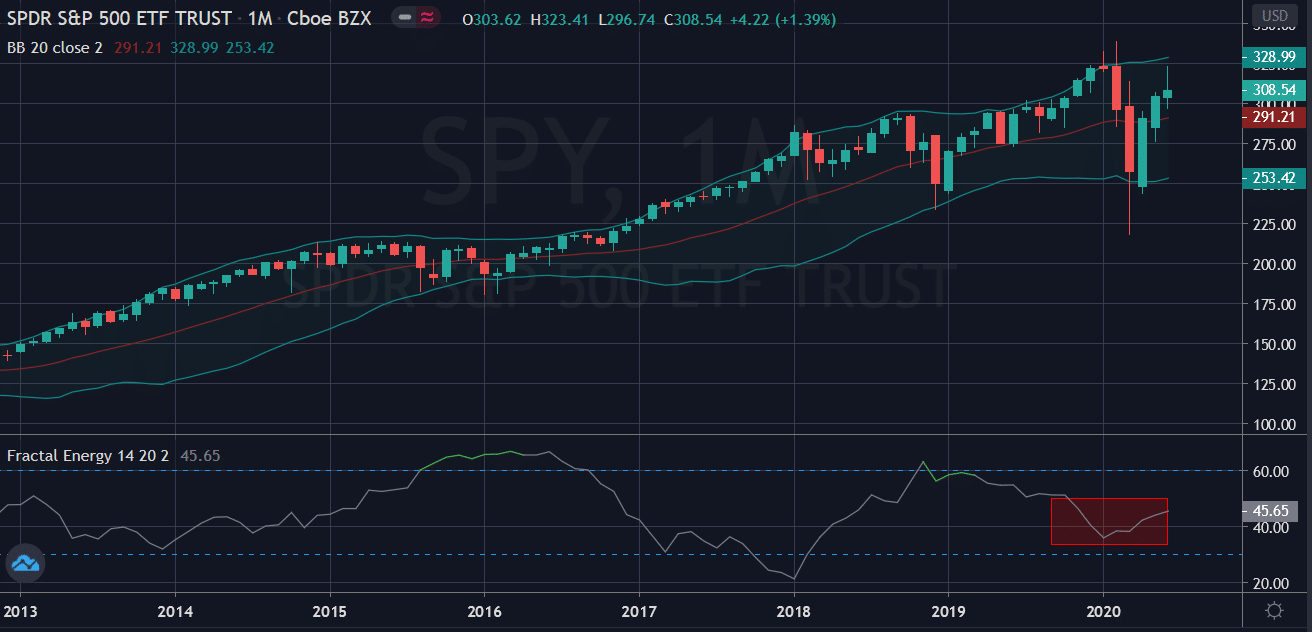
Source: Thinkorswim
The story still doesn’t seem to change much, as the SPY’s are stuck in the middle / top of their range as the Fractals work their way higher.
Now, since the SPY is actually near the top Bollinger Band, it might suggest that we see a slight pullback in the SPY instead of an immediate rally from here.
But it’s still too early to tell, and we need to wait for the Fractal Energy to charge up before it can make its move in either direction.
Wrapping Up
As a trader it’s common to get “tunnel vision” when you are focused on a single chart.
Before you know it, you start seeing things that you never saw before.
Chart patterns morph into shapes, and you trick yourself into seeing anything that supports your trade idea.
But if you use these tips to your advantage you can get an edge plus a head start trading on some of the markets largest moves.
0 Comments