These last few days have been stirring up excitement in the markets as we dropped almost 10%
And as quickly as stocks were melting up…they melted down even faster.
But it didn’t catch everyone off guard
You see, there is an indicator I developed which warned me in advance of this sharp market selloff
I know you might be skeptical
And I was at first when I stumbled upon the power Fractal Energy really has on stocks
But let me have 2 minutes of your day, and you will have your mind blown away by exactly what this indicator can do for you.
Now what are you waiting for – you need to see what this indicator is predicting for the future of the SPYS
Fractal Energy
As a trader, spending hours going through stock charts and looking for patterns is just part of the day in the life of a professional trader.
To cut down the work that I have to do every day, I only focus on stocks that meet qualifications set by the Fractal Energy Indicator.
When looking to understand what price action is doing you need to reference information other than a basic stock chart to get a true edge in the markets.
And by having an indicator such as the Fractal Energy indicator you can determine stocks that are charged to run or exhausted and ready to stall out.
But first – What are fractals?
There are 2 main components of Fractal Energy:
- Markets Fractal Pattern
- The Internal Energy
By combining those two different components you create a single indicator that is able to successfully determine the strength or weakness of a trend on any stock.
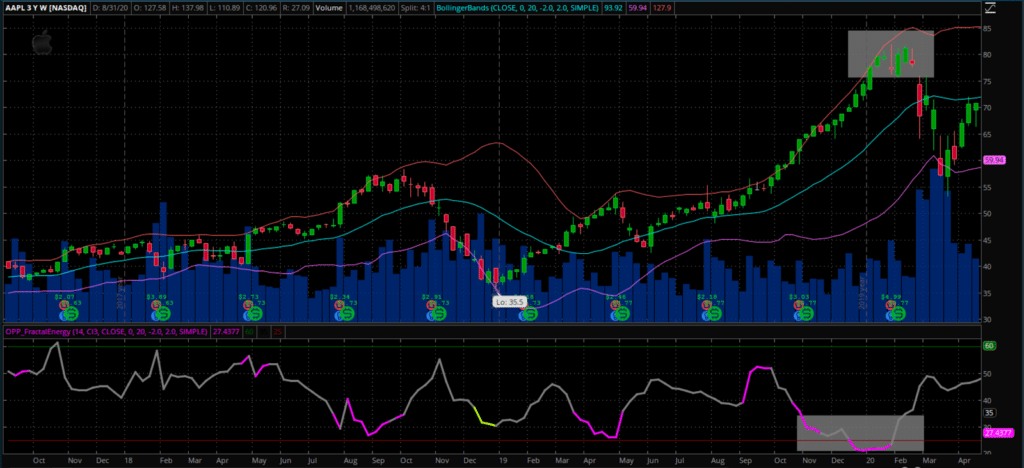
Source: Thinkorswim
You can see that the Fractal Energy Indicator was signaling exhausted energy to AAPL forming at the beginning of 2020.
And then shortly afterwards, the stock plunged lower towards the lower Bollinger Bands.
In this chart you can see two key factors as how the trade unfolded:
- Price couldn’t break above the resistance level at $325
- The Fractal Energy Indicator was severely exhausted
From the technical analysis viewpoint, the failed breakout was a large bearish signal for AAPL. Then combined with the internal energy, or Fractal Energy showing that it was weak, it was the perfect setup for AAPL to sell off!
And Fractal Energy strikes again on AAPL in the last few days!
Here’s what Fractal Energy had in store for AAPL this time around
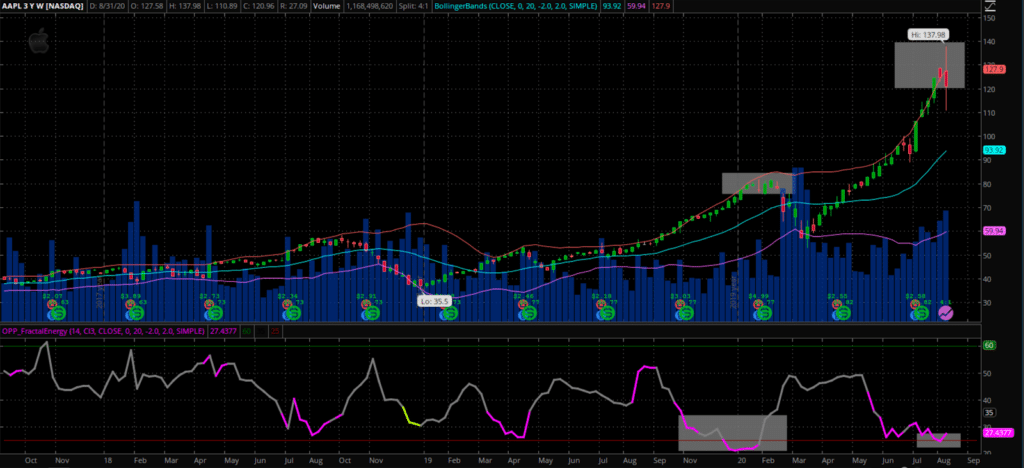
Source: Thinkorswim
And it’s back at it again!
Fractals successfully called the top in AAPL a second time in the same year!
And if you take a look at the Fractal Energy plot at the bottom in purple, it’s only the second time this year it got this low into the exhausted threshold.
Then combine it with Bollinger Bands, AAPL didn’t stand a chance but to succumb to a huge pullback!
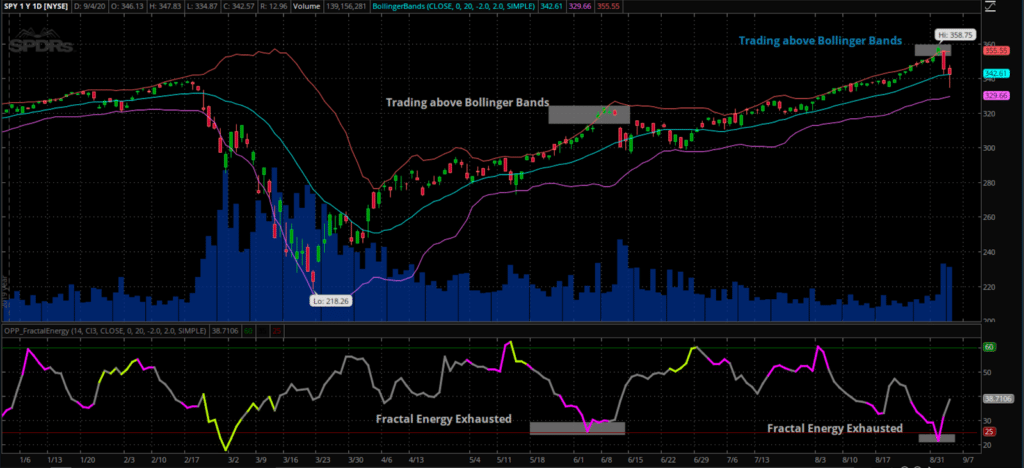
Source: Thinkorswim
And just like AAPL above, the SPY showed similar characteristics to the other charts.
As the Fractal Energy turned purple, and breached the lower threshold combined with the stock being near the upper Bollinger Bands, it signaled the selloff is going to soon to come in the upcoming days
Credit Spreads For The Win
If you don’t want to use this as a trading indicator… There is one thing that I can highly recommend, and that’s using Fractals as a market sentiment indicator.
Fractals are the inner workings of the markets, from what the whale investors are thinking on any given day to the market specialists on the floor of the exchanges.
Which is exactly why I based my credit spread trading strategy together with Fractal Energy!
I needed an edge in the markets that told me when to sell credit spreads in order to generate income for my trading business.
The Credit Put Spread is a neutral to bullish options trading strategy.
It aims to capitalize on both sideways or upward price movement of the asset and theta (time) decay.
What does that mean exactly?
It means that you receive the cash upfront …That’s right, you get paid to take that trade!
The Odds Are Stacked In Our Favor
Option sellers take maximum advantage of the option time decay theory, commonly known as Theta Decay.
OTM options lose value quickly and become worthless at expiration.
We can take advantage and be the house with odds in our favor on every trade
Don’t forget that an option buyer needs to be right about direction and time!
Remember traders, there are many ways to make money in this market and selling options is one of my absolute favorite go-to strategies.
Key Points:
- Credit Put Spreads profit if the stock goes down, stays the same, or goes up
- Limited risk
- Puts the house odds in your favor
- Allows you to get paid to take risk
Wrapping up
Fractals are the cornerstone of Options Profit Planner
When it comes to placing a trade, I always make sure there’s an edge by leveraging the power of the internal energy of a stock and pattern.
But what’s extremely important to remember is that there is a strategy for both going long and short stocks that are available to you.
Plus Credit Spreads give unique advantages to traders over debit spreads, with the most important being that you are paid upfront to place a trade!
0 Comments