Feel like you’re struggling to find the right indicator for your trading?
Are you going in circles with testing out different off-the-shelf indicators?
Well, today you’re in luck.
You see, there is this one proprietary indicator that I’ve created that knows the internal energy of every stock.
I’m talking about Fractal Energy.
But what is Fractal Energy?
Fractals are simply recurring patterns in nature, and the Fractal Energy indicator is used as a trading tool to allow you to identify and trade Fractals efficiently.
And recently, the Fractal Energy indicator has accurately identified the market bottom in March, and now again at all time highs in the SPY.
So let me show you exactly what Fractals are and how you can them to your technical trading “tool belt”
Fractal Energy
What is Fractal Energy?
Simply put…Fractal Energy is considered the most powerful mathematical equation that is used to solve the unsolvable.
In fact…Fractals are used in defining coastal patterns and snowflake designs.
Did you know that Fractals are actually a never-ending pattern… which gives them their unique powers of explaining the unexplainable?
It’s true! Fractals are infinitely complex patterns that are self-similar across different scales and are created by repeating a simple process over and over in an ongoing loop.
So… when I was searching for ways to tap into the inner workings of the stock market, I knew right away Fractal Energy would do the job!
Before we begin, there are 2 main components of Fractal Energy Indicator that you need to know.
Two components:
- Markets Fractal Pattern
- The Internal Energy
And by combining those two different components you create a single indicator that is able to successfully determine the strength or weakness of a trend on any stock.
Fractals tap into the inner strength of every stock across every time frame giving you the most comprehensive understanding of what a stock is going to do in the future.
Here is a recent example of the Fractal Energy Indicator that timed the recent market bottom perfectly.
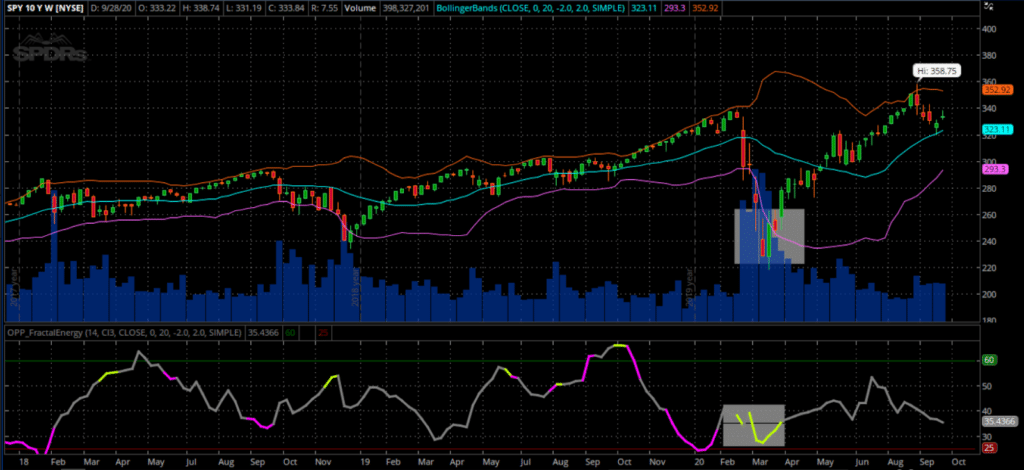
Source: Thinkorswim
This is an example of how Fractal Energy combined with Bollinger Bands was able to pick the bottom on the SPY after the massive selloff!
And Fractal Energy is signaling the next big move in the markets.
Let’s take this one step further and break down the Fractal Energy Indicator one step further
Fractal Energy Indicator vs RSI
The Fractal Energy Indicator is a momentum indicator that measures the internal energy of a stock and plots 3 zones: Charged, Trending, and Charged zones.
Unlike RSI’s that evaluate overbought and oversold values, Fractal Energy can tap deep into the stocks internal momentum.
So let’s take a look at what these 3 readings are for The Fractal Energy Indicator.
Charged-up vs Overbought
When looking at a stock chart, many times a trader is just guessing at what levels to enter their trade at.
And to make it worse, there is hardly any information that a trader can reference just by looking at standard indicators.
When reading the RSI, when a value is near or over 70, a stock is considered to be overbought.
At this point, a trader would most likely remove shares of the stock they own at these levels, or execute a short trade.
And that’s exactly the opposite of what a trader should really be doing at certain key levels.
The RSI
Let’s take a closer look at CMG with an overbought RSI reading.
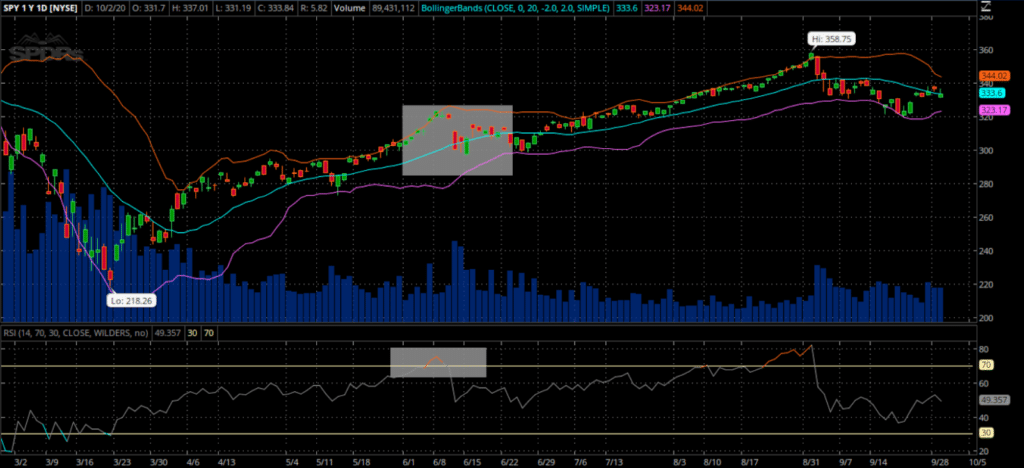
Source: Thinkorswim
According to the traditional RSI strategy, if the value of the indicator was to reach overbought zones, a trader would look to either not enter or go short a stock.
This zone is highlighted in the red box on the subplot RSI.
Additionally, you can see by the other red box on the price chart that the price of SPY was reaching all time highs and a “triple top” pattern was forming.
Again, for other indicators like the RSI, this is a reason to go short a stock.
Why did this happen?
Because RSI is a simple calculation that measures the number of moves up and down to determine the ratio of up bars to down bars on a stock.
This ratio is inherently flawed as it doesn’t take into account any energy the stock might have built up going into the overbought zone.
And since we can see into the future in this example, we can tell that this trader would have been in some pain taking a max loss on his trade.
The Fractal Energy Indicator
Now let’s take a look at how we would look to CMG with a charged reading in the Fractal Energy Indicator
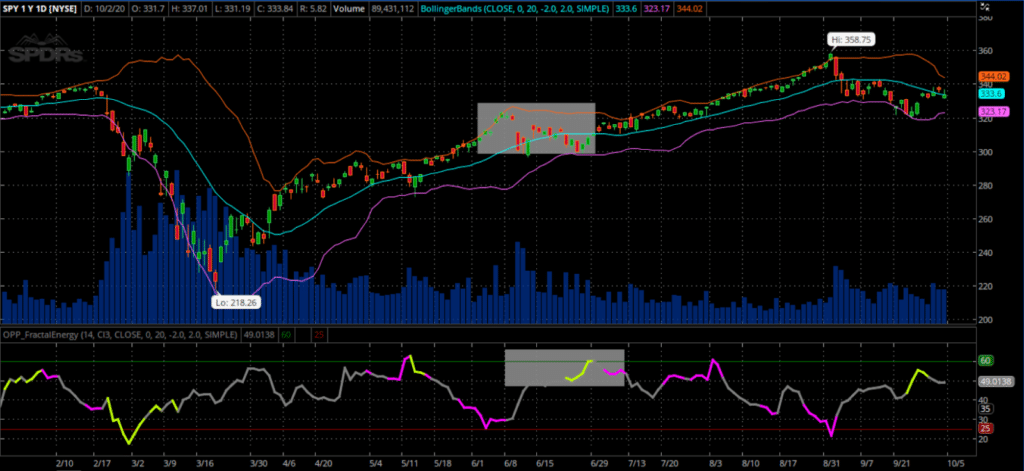
Source: Tradingview
Now according to the Fractal Energy Indicator, we would actually want to get long at this price level as we have a charged reading on the indicator!
The Fractal Energy Indicator of SPY at the time was above its “charged” value with plenty of headroom to go for further price action, as seen since the indicator is not above the dashed blue line.
And once the price broke out from the highs on SPY , the Fractal Energy unleashed itself and with fury drove the stock price higher!
The Power Of Fractals On Stocks
Now that we can see Fractal Energy works on the markets, let’s take a look at a popular stock that signaled a huge momentum buy alert.
Here is an example of the chart on Chipotle (CMG) using both the RSI and Fractal Energy and how different one is from the other when it comes to picking direction of a stock.
In this example, the RSI on CMG is showing that at the technical level called a “Double Top” the RSI is overbought. When this occurs, the overbought reading is telling the trader that the stock is most likely read to be a short trade.
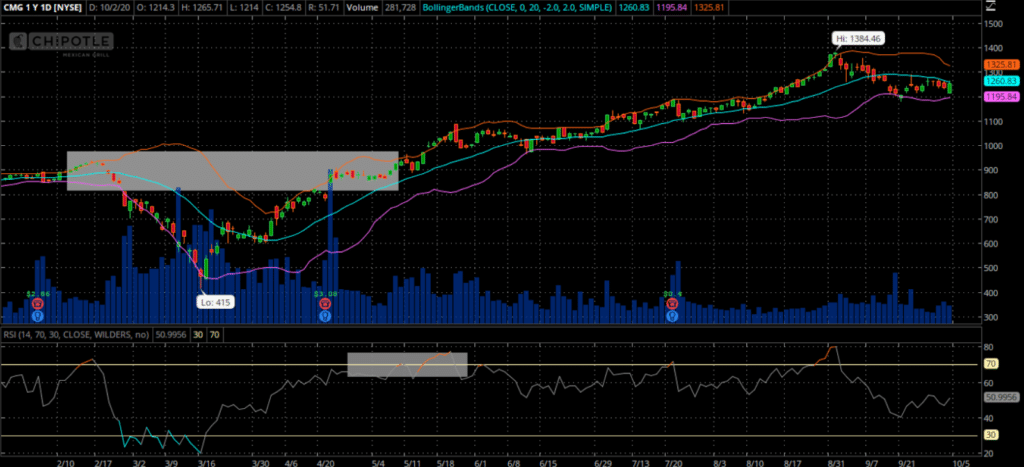
Source: Thinkorswim
As you can see, this is actually not what happened at all!
The stock continued to run higher after the “sell signal” that you got from the RSI indicator.
Now let’s take a look at the Fractal Energy indicator and what it said about CMG’s “Double Top”
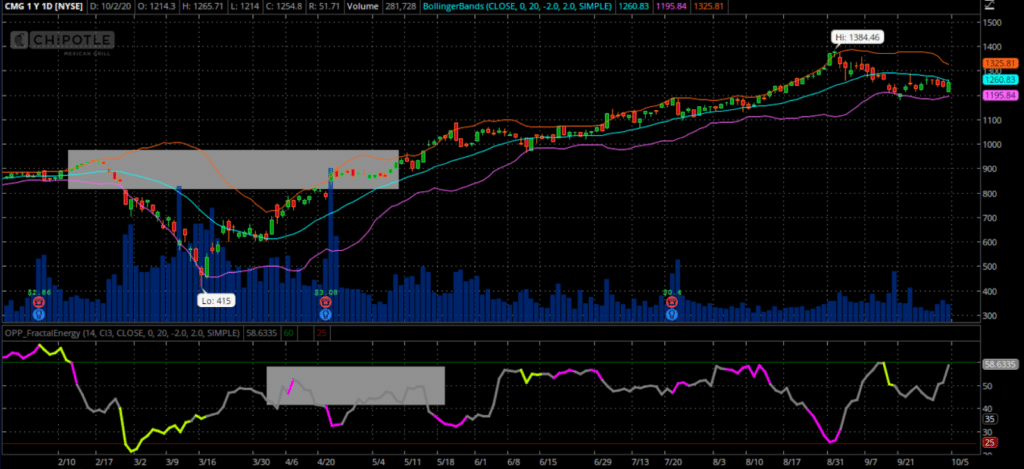
Source: Thinkorswim
And right at the technical level, where the RSI would be telling you to go short, the Fractal Energy Indicator is telling you that the stock is “charged” and ready for a move higher.
So instead of going short the stock, a trader would actually want to go long at these levels.
And that’s not where the power of fractals end.
Fractals on the AAPL
Even though I look at Fractals on the SPY to gain market sentiment, Fractals can be used on specific stock to gain an edge to what the underlying energy
Just take a look at this recent example in AAPL:
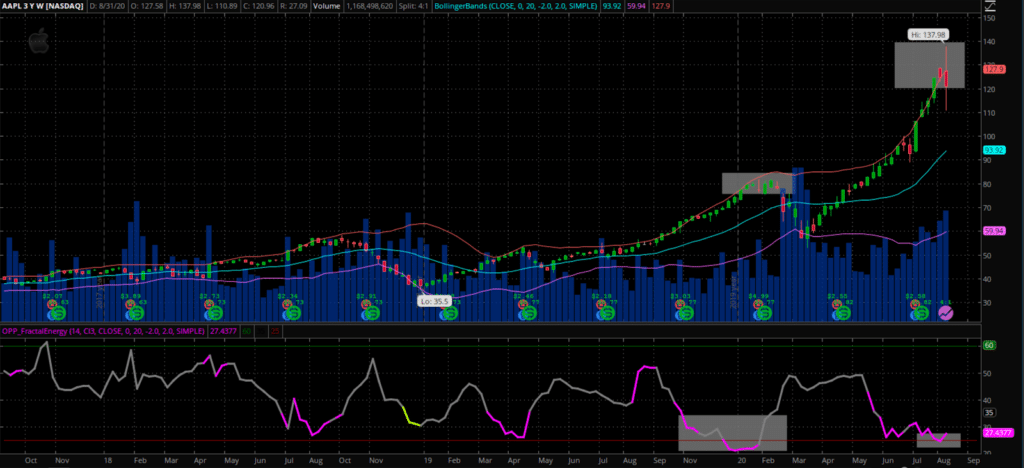
Source: Thinkorswim
You can see that the Fractal Energy Indicator was signaling exhausted energy to AAPL forming at the beginning of 2020.
And then shortly afterwards, the stock plunged lower towards the lower Bollinger Bands.
In this chart you can see two key factors as how the trade unfolded:
- Price couldn’t break above the resistance level at $325
- The Fractal Energy Indicator was severely exhausted
From the technical analysis viewpoint, the failed breakout was a large bearish signal for AAPL. Then combined with the internal energy, or Fractal Energy showing that it was weak, it was the perfect setup for AAPL to sell off!
Final Thoughts
There is a time in a new traders career when they start learning about indicators.
And next thing you know, their charts turned into a mess of indicators that resemble a bowl of spaghetti, or they are focused simply on the wrong indicators that the herd uses, like the RSI indicator.
Unfortunately for many, the RSI indicator got this trade wrong…
So don’t let this happen to you!
The solution is a single indicator that works in an up, down, or sideways market that you can put to work as soon as your very next trade.
So say goodbye to cluttered charts and those broken indicators and start focusing on a single indicator, the Fractal Energy Indicator!
0 Comments