Do you often second-guess yourself after getting into a trade…
“Is the right price?” “Is my timing good?”
The good news is that this is an easy problem to fix.
I utilize a proprietary trading indicator that helps me improve my accuracy and timing…
And today I want to talk to you about how it works…
And how you can start implementing it to get better entries and exits on your trading.
What Is Fractal Energy
There are 2 main components of Fractal Energy:
- Fractal Pattern
- Internal Energy
Fractal Pattern
Fractal Energy is the mathematical equation of nature.
This mathematical model explains some of nature’s unsolvable problems, such as the recurring patterns at progressively smaller scales and the partly random characteristics of snowflakes, the flow of liquids, and the length of a coastline.
Powerful, isn’t it?
I thought so! This is why I made sure to build my trading strategy around fractals and used them to find places to buy and sell stocks.
Internal Energy
Everything in nature is made up of energy, from a tree in the forest to a CPU on your computer.
But some objects have more energy than others, especially when it comes to potential energy that is a measure of the stored energy in an object, like a spring that is compressed.
The power of fractals allows me to determine the strength of trends and how much “life” is remaining in a stock’s movement.
Fractals In The Markets
Now I know you are thinking, “how in the world can Fractals even apply to the financial markets?”
Well, let me tell you one thing – Fractals find a way to influence everything around us, and stocks are included!
Don’t believe me? Check this trade out in AMZN.
Here’s an example of how fractals drove stock prices higher after signaling that energy was about to be released like a compressed spring full of potential energy.
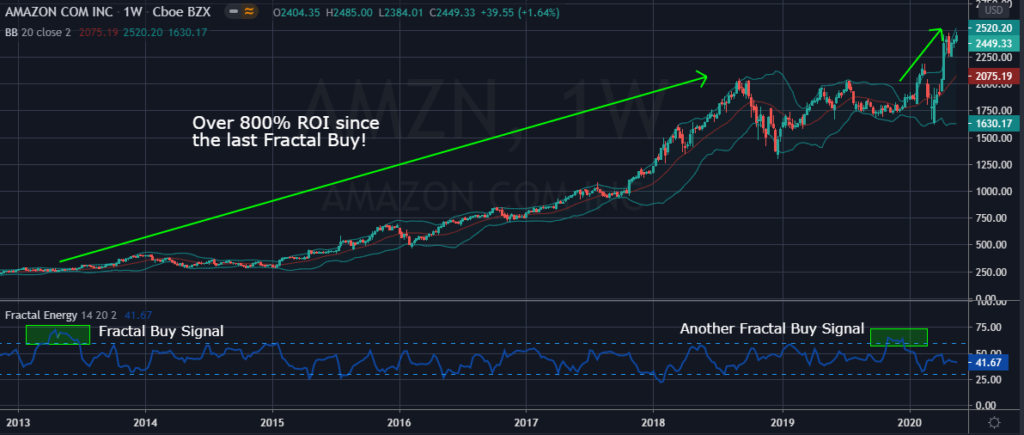
Source: Tradingview
That is just one example of the power of Fractal Energy when applied to higher time frames!
Now…let’s dive deeper into Fractal Energy and how to spot trade signals on higher-level time frames for explosive gains!
Fractal Energy – A Deeper Dive
Fractal Energy is an extremely powerful tool for timing market reversals and entry points for our trades.
Let’s take a look at how powerful this signal was on GS that resulted in over a 25% ROI in under 6 months!
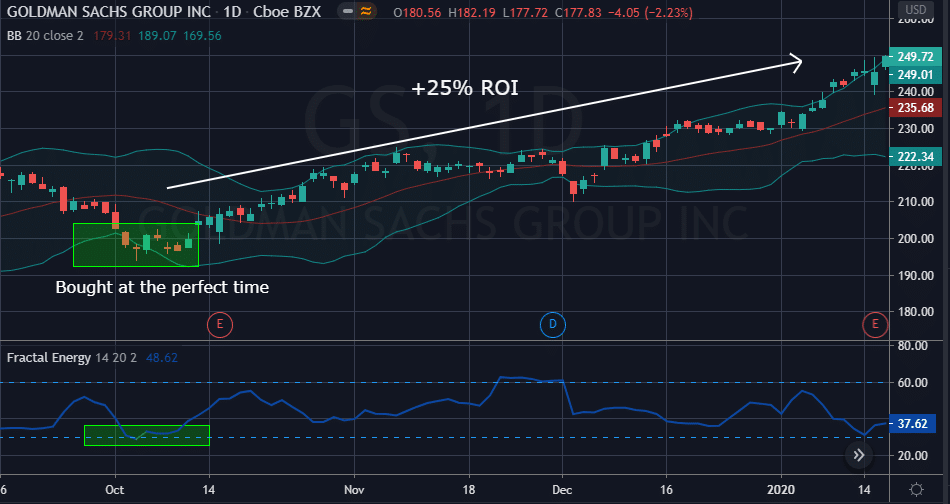
Source: Tradingview
Remember, with great power comes great responsibility.
And sometimes the fractals might signal a stock to buy a little too early. Here’s what I mean…
Here is an example of a trade that you could have taken based on Fractal Energy that would have gotten you into a trade too early leaving you with a losing trade.
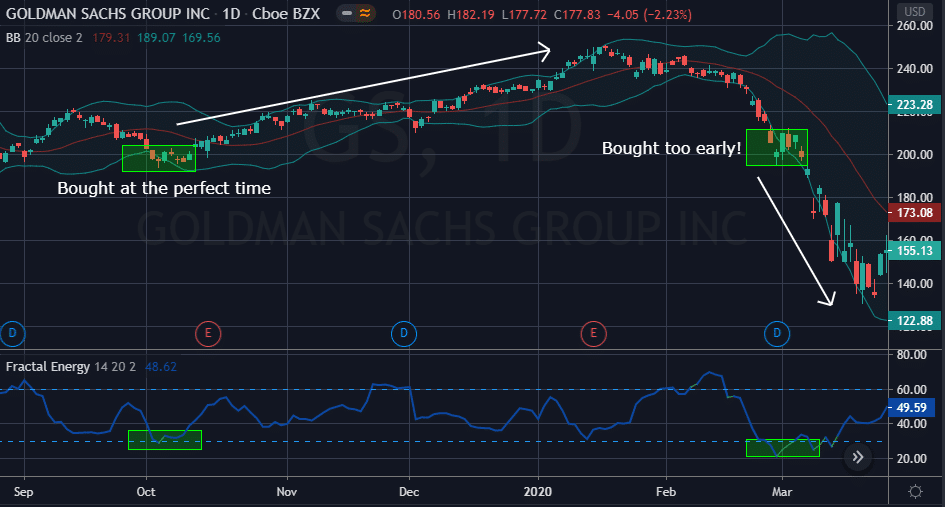
Source: Tradingview
So… if the fractals are too early then how do we fix this problem?
By applying higher-level time frames to the analysis and get a clearer picture of the trade.
Now let’s take a look at how multiple time frames can greatly improve your edge on your trades.
Fractal Energy – Multiple Time Frames
One of the problems you face when trading any indicator is when are you supposed to execute and buy the stock when a signal is generated.
As you can see in GS if you bought when the daily Fractal Energy reading was less than 30 you would have been stopped out on this trade.
Instead, by waiting for the higher time frame to have a Fractal Energy reading also less than 30, you would have gotten in at a better price near the bottom of the sell off.
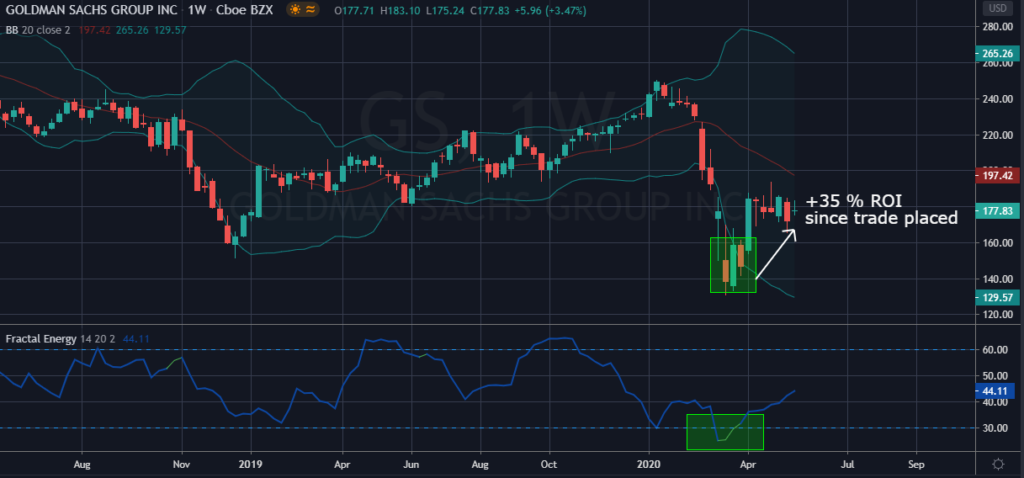
Source: Tradingview
Now that the higher time frame also has exhausted fractal energy readings, it’s safe to say that prices will finally head higher at this point.
Multiple Timeframes – Hidden Patterns
Fractal trading on multiple timeframes is a concept that many technical traders ignore because they don’t realise timeframes can influence their trades.
For example, a trader plans to go long from a daily “V” reversal pattern. This trade seems perfectly acceptable on a daily chart, but when the weekly chart is referenced, it’s actually showing that the stock is still falling, heading towards its 52-week low for support. Remember, this is what we saw from the Goldman Sachs trade from earlier.
Multiple timeframe analysis with fractals have two main components:
- Reference higher chart time frame to arrive at a bigger picture awareness of the security in question. i.e.) to determine the direction and strength of longer-term trend
- Traders may then look to a lower chart time frame to find entry and exit triggers for their trade.
Along with using higher and lower time frames for timing a trade, another aspect to fractals is their ability to cause patterns to “nest” inside one another.
For example, you might get a V bottom on a daily timeframe and a W bottom on a weekly timeframe. It is common to also have this occur with bull flags, triangles, and other technical patterns.
Now let’s take a look at CMG and how patterns are found on multiple timeframes.
CMG on the Daily timeframe:
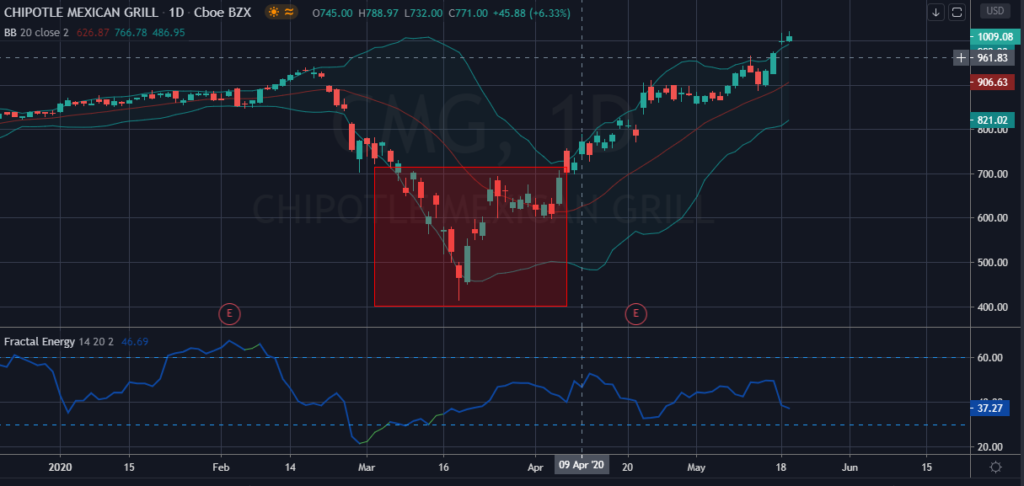
Source: Tradingview
The candle at the bottom of the market collapse was one of the few bullish candlestick patterns. Let’s take a look at what the higher-level pattern looked like.
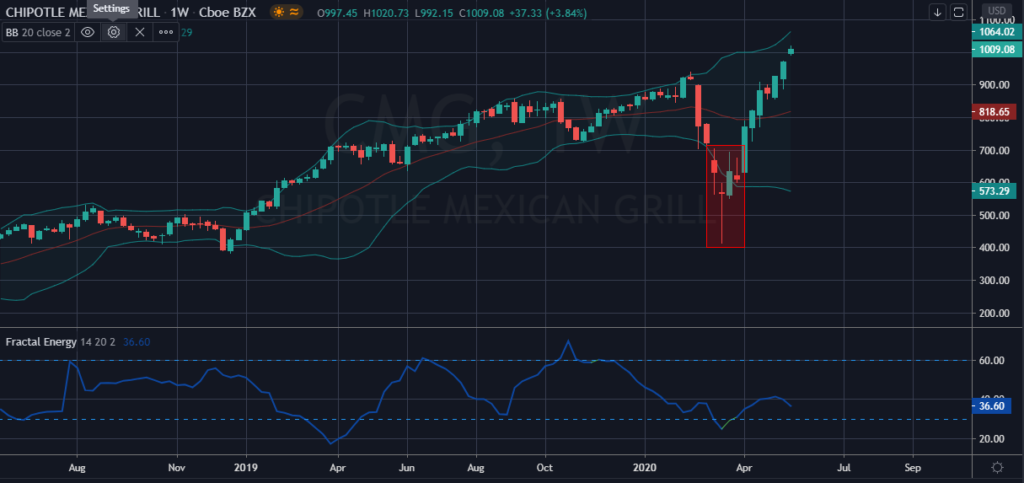
Source: Tradingview
In this example, there were 2 intraday patterns that formed the daily reversal bar, the strong reversal pattern, and a bull flag continuation.
As you can see, a simple reversal pattern on a weekly time frame can incorporate a lot of daily price action. This means that something that looks like a buy on a daily chart should always reference a higher time frame to confirm the reversal pattern.
By doing so this confirms the stock is not actually forming another pattern on the higher chart pattern and causing a conflict of your trade direction.
Wrapping Up
There are many explanations as to why exactly patterns are found “nesting” inside one another.
Maybe it’s herd mentality, fractals, or perhaps just a coincidence… but for one thing, I never place a trade without confirming the direction with the higher time frames!
From the examples above you can see that there is usually a lot of room left between when the daily signaled its trade alert to the weekly confirming the trade.
And if you get in too early to the trade you will end up turning a potential winning position into a loser.
Now, if you want to learn more about how fractal energy can help boost your trading results. Then make sure you join me for my latest training session. You can register for it, right here.
0 Comments