Are you fed up with the noise of traditional indicators?
I know I am and I don’t blame you if you are.
You see, there is over a thousand different indicators out there to choose from and it’s no wonder that finding the right one is so challenging
And to compound the issue, many technical indicators can give both a bearish and bullish signal to the trader looking at it.
But there’s a solution to this problem and it’s more simple than you might think.
And it only requires two indicators for your research.
Fractal Energy and Bollinger Bands.
And by simply focusing on these two indicators, you will declutter your research and start generating income week over week.
Options Profit Planner
Every business starts with an edge in the markets
And no matter how small this edge is, it is well defined and precisely executed to generate maximum returns for the business.
The same goes for trading… you need to define your edge and execute it flawlessly to generate income for your account.
The Options Profit Planner system is broken down into 3 main parts:
- The Scanner to locate stocks to trade
- A Credit Strategy to put the odds of the casino in my favor
- Fractal Energy and Bollinger Bands to determine the energy of the stock
But we are going to focus on the last item, Fractal Energy and Bollinger Bands that are used to determine the near term movement on the stock.
Fractal Energy
As a trader, spending hours going through stock charts and looking for patterns is just part of the day in the life of a professional trader.
To cut down the work that I have to do every day, I only focus on stocks that meet qualifications set by the Fractal Energy Indicator.
When looking to understand what price action is doing you need to reference information other than a basic stock chart to get a true edge in the markets.
And by having an indicator such as the Fractal Energy indicator you can determine stocks that are charged to run or exhausted and ready to stall out.
But first – What are fractals?
The power of fractals allows me to determine the strength of trends and how much “life” is remaining in a stock’s movement.
There are 2 main components of Fractal Energy:
- Markets Fractal Pattern
- The Internal Energy
By combining those two different components you create a single indicator that is able to successfully determine the strength or weakness of a trend on any market or stock.
Let’s take a look at this example of Fractal Energy and the Bollinger Band working on the SPY
The SPY:
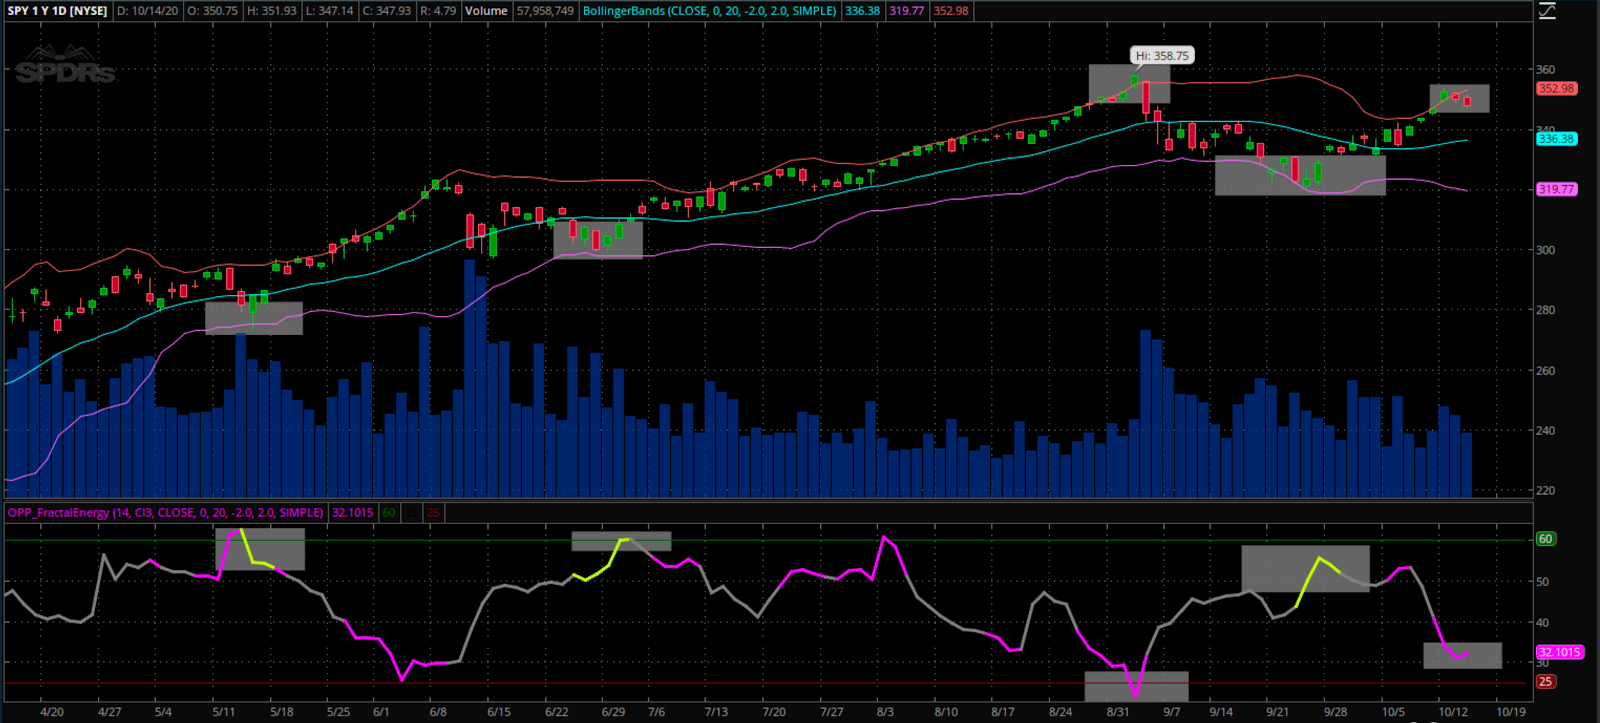
Source: Thinkorswim
Bollinger Bands
Bollinger Bands were developed by John Bollinger as a price envelope designed to define the upper and lower price range levels of a stock.
Bollinger Band consists of a middle Simple Moving Average (SMA) along with an upper and lower offset band. Because the distance between the bands is based on statistics, such as a standard deviation, they adjust to volatility swings in the underlying price.
How do you read them?
Bollinger Bands help to determine whether prices are high or low on a relative basis, and according to these calculations, price should fall within range 95% of the time!
How this indicator works:
- When Bollinger Bands tighten, there is a high likelihood that price will have a sharp move
- When the bands separate by an unusually large amount, this is showing a significant increase in volatility or a gap in stock price.
- The stock price can exceed and even hug or ride the band price for extended periods of time.
- Price has the tendency to bounce within the bands’ envelope, touching one band and moving back towards the other.
- You can use the middle SMA or opposite band as target prices and exits for your trading
- If prices move outside of the band, it’s expected to see a trend continuation until the price moves back inside the band.
Credit Spreads
As an options trader, I don’t want to go to the casino…
Instead, I want to BE the casino!
And I do this by trading credit spreads instead of debit spreads.
Option sellers take maximum advantage of the option time decay theory, commonly known as Theta Decay.
OTM options lose value quickly and become worthless at expiration.
Now what do one of these strategies look like?
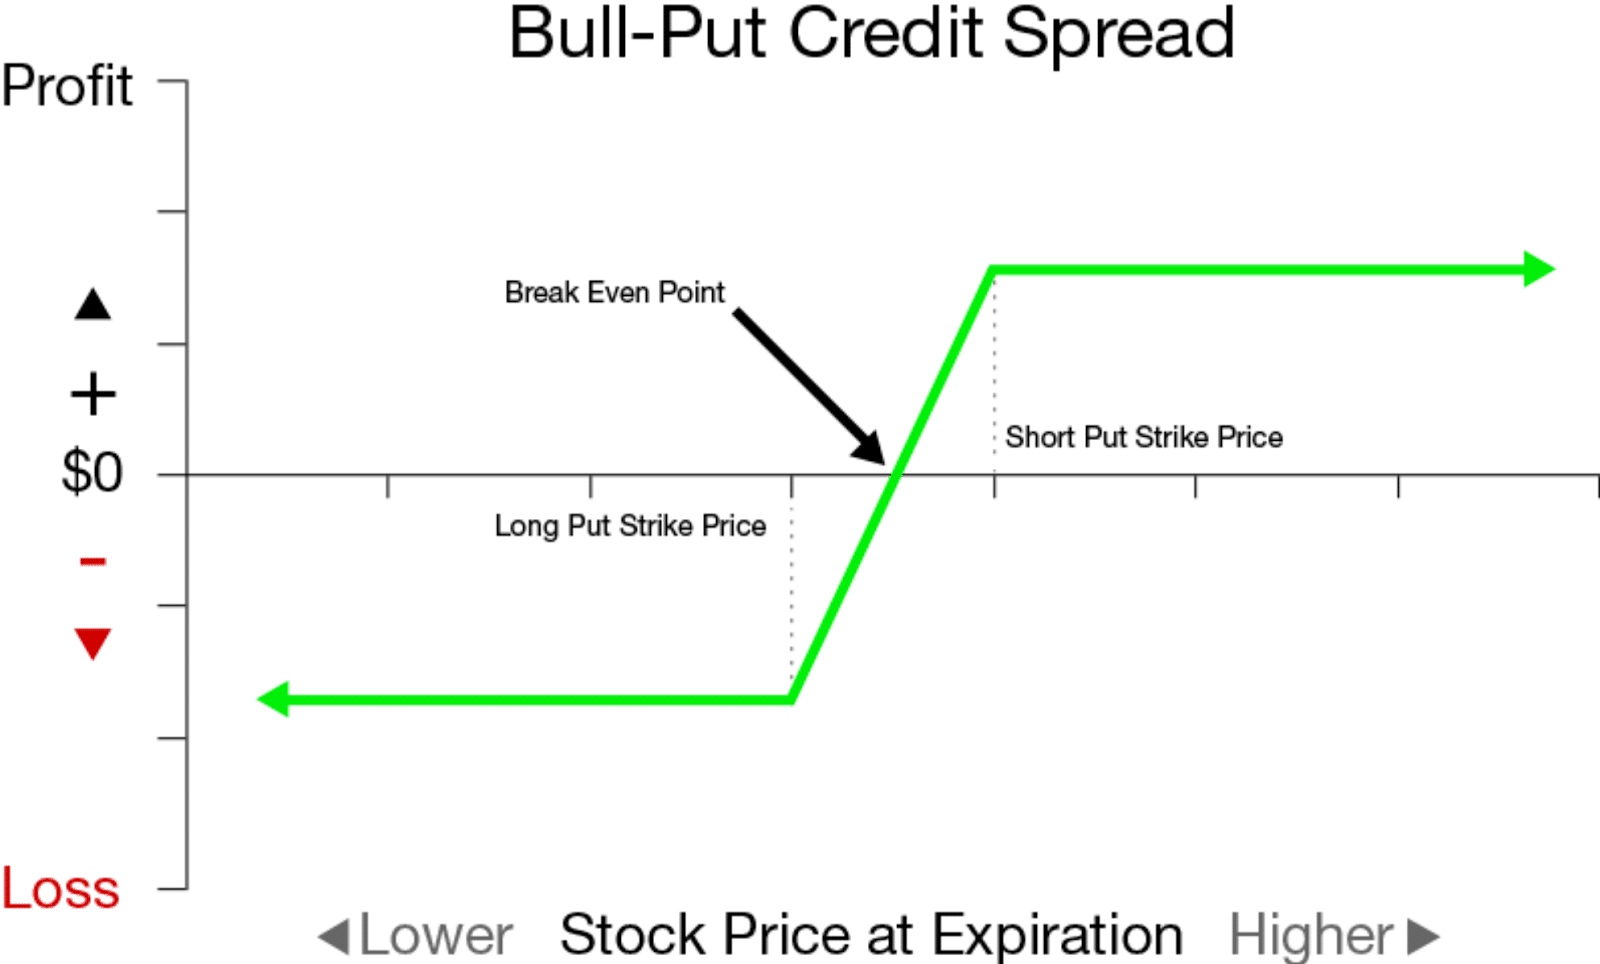
I know this might look scary, but it’s a lot more simple that you might think.
In order to create this strategy, you would want to sell a higher valued put, and buy the lower valued put as protection.
What does this give you?
It allows you to collect a net credit on the trade, which is the difference between the two puts.
But why do I like this trade?
Plus when you generate income from collecting premium, you can steadily return close to 100% returns each and every trade.
Remember traders, there are many ways to make money in this market and selling options is one of my absolute favorite go-to strategies.
Key Points:
- Credit Spreads can profit if the stock goes down, stays the same, or goes up depending on a Call or Put Spread
- Limited risk compared to Naked Puts and Naked Calls
- Puts the house odds in your favor compared to buying Options or Stocks
- Allows you to get paid to take risk unlike stocks
And you see, when it comes to placing a trade, you need these 4 things
- To have the stock selected
- A price range identified
- An indicator to show you strength of the stock
- And an options strategy to tie it all together.
Combining The Two Charts
When you combine the two, you now have a vision of the market that is unique and can pick some of the most favorable trading opportunities.
And when you strip out the noise of the other indicators, you declutter your trading and can focus on what matters.
Here’s a view of both of the Bollinger Bands and Fractal Energy and it shows where the market swings are for trading credit spreads.
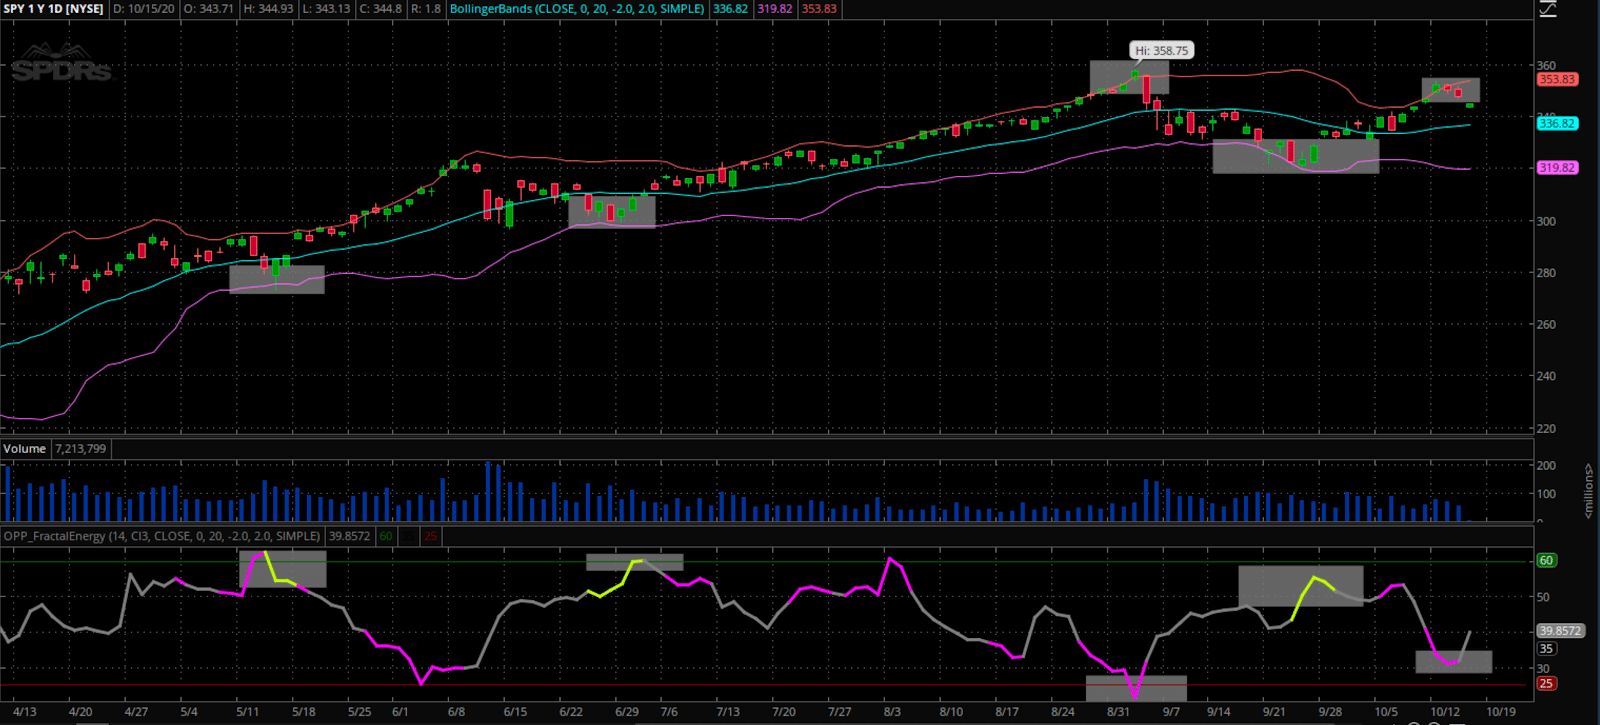
Source: Thinkorswim
And currently, the SPY’s appear to be entering a zone where they are considered to be exhausted on the Fractal Energy, and turning over at their upper resistance levels near the Bollinger Bands.
Putting that together, you get a great spot to go short the market and sell a Credit Spreads strategy to generate income.
Putting it all together
I know this market is crazy… and even overwhelming to many. But you have to trust the tools that everyone uses to trade safely.
And two of those tools are the Bollinger Bands and the Credit Put Spread. When they are combined, they really are one of the best strategies a trader can deploy in markets that are unpredictable.
When looking at these two strategies combined, this really is where statistics and probability really shine and make for a highly profitable trading opportunity.
Not only do I trade using an indicator that tells me 95% of the time price will stay inside a range, I also combine it with an options strategy that can pay me 100% ROI on my trade if timed correctly to the markets.
So… to recap what makes this trade a really high probability winner.
- The Options sellers always have statistical advantages over buyers. That’s a built-in feature for the entire options market, regardless of calls or puts.
- Trading credit spreads can pay me 100% returns, which cannot be done when buying calls or even the stock outright.
- Lastly, combining a proven indicator into my trading system that when signals a stock is oversold both statistically and on the charts. Remember, there is a 95% chance it will head higher and not lower.
Click here to learn how I use the Bollinger Bands weekly to determine the market direction
0 Comments