They say there is nothing certain in life besides death and taxes.
I disagree.
Unfortunately, in trading, there are no certainties either. The only thing a trader can do is find ways of stacking the house odds in their favor and executing their strategy.
If the strategy has an edge and they stuck to their trading plan then profitability should be right around the corner.
That’s exactly what my trading strategy does for me.
It finds me the perfect setups and delivers timely market signals that deliver win after win.
In fact, since starting this service last year I have yet to see a losing trade, and consistently racking in win after win on every trade.
So, what’s my secret?
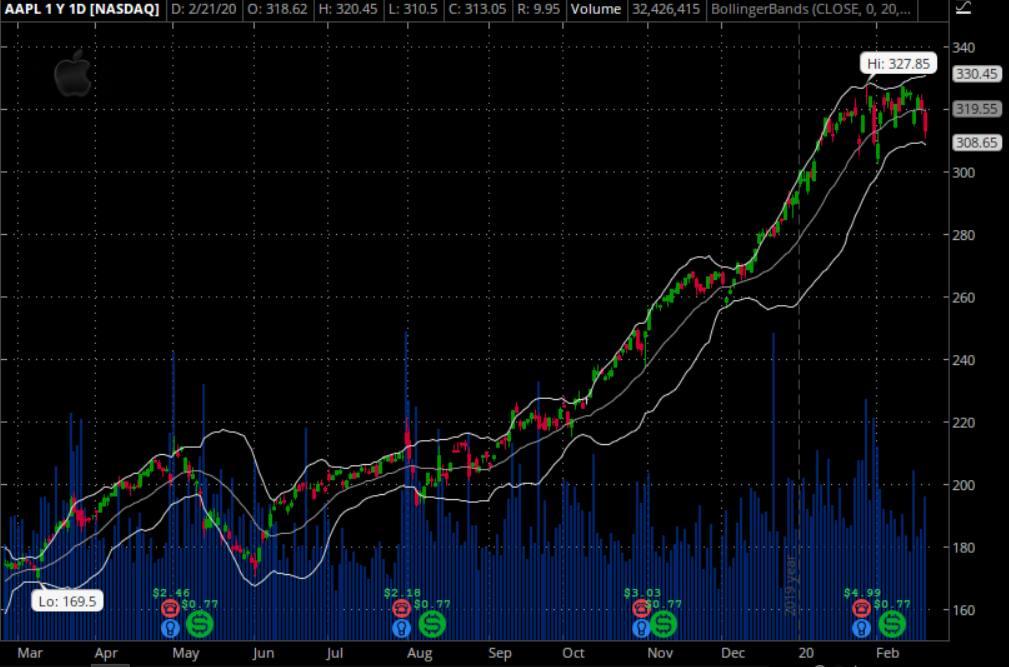
Source: Think-or-Swim
Let me ask. Do you see anything from this chart?
You probably don’t. And that is ok!
But to me, this is 1 step away from being a perfect trade
Let me explain.
Bollinger Bands
Bollinger Bands were developed by John Bollinger. This technical analysis tool is defined by calculating two standard deviations from the average price based over a specific time.
Two standard deviations is a mathematical term that states a stock’s price should fall within that range 95% of the time.
And this is all statistics and probabilities I won’t bore you with here.
Let’s take a look at what I mean…
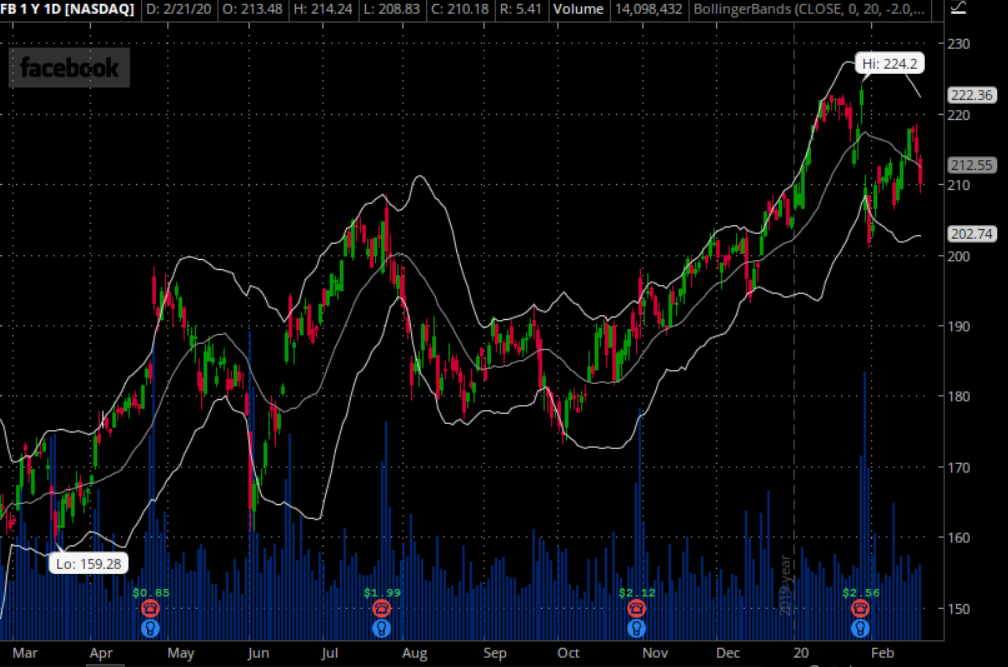
Source: Think-or-Swim
As you can see, the price of FB’s stock rarely traded outside of this band.
And if it did.. Well it quickly traded back inside of it!
You know the best part…
All you had to do as a trader is wait for the price to trade under those Bollinger Bands and you would have won every single trade on that stock.
Talk about stacking the odds in your favor!
Next…
The Put Credit Spread
When I want to trade a stock like FB or AAPL above, there are only 3 real options you can choose from.
Trading choices you can make for this trade are:
- Buying stocks
- Buying calls
- Selling Puts
As a stock slowly grinds higher, I don’t want to buy the underlying stock as it ties up too much capital and I don’t get paid for my risk. The same reasoning applies to buying call options as well, there is just no upfront payment to take this trade.
Now with selling puts, I am able to still participate in a bullish trade and get paid to do so!
A put credit spread involves selling one put option at a strike below the current price and buying a put option at a lower strike price. Both options will have the same expiration.
When you trade this strategy you will receive a credit upfront for taking this position. The maximum profits you can make on this trade is the credit you received when the stock trades above the upper strike at expiration. The maximum loss on this trade is calculated by the distance between strikes minus the credit received.
For example:
- I sell the $200 put strike that expires next month
- I buy the $195 put strike that expires next month
- I receive $1.00 for my trade, or $100 per spread
- My maximum loss is $400 per spread ( 200 – 195 – 1 * 100 = $400 )
If this strategy is executed correctly, you are looking at 100% ROI on your trade when the options expire worthlessly!
Putting it all together
This is where statistics and probability really shine and make for that almost guaranteed winning trade.
Not only do I trade using an indicator that tells me 95% of the time price will stay inside a range, but I also combine it with an options strategy that can pay me 100% ROI on my trade!
So what makes this trade a really high probability winner.
- The Options sellers always have statistical advantages over buyers. That’s a built-in feature for the entire options market, regardless of calls or puts.
- Trading credit spreads can pay me 100% returns, which cannot be done when buying calls or even the stock outright.
- Lastly, combining a proven indicator into my trading system that when signals a stock is oversold both statistically and on the charts. Remember, there is a 95% chance it will head higher and not lower.
So want to learn exactly how I put this all together and more with that other indicator you may have noticed at the bottom of the charts?
Well to find out – click here to join Options Profit Planner today
0 Comments